eBay 2015 Annual Report Download - page 100
Download and view the complete annual report
Please find page 100 of the 2015 eBay annual report below. You can navigate through the pages in the report by either clicking on the pages listed below, or by using the keyword search tool below to find specific information within the annual report.-
 1
1 -
2
-
3
-
4
-
5
-
6
-
7
-
8
-
9
-
10
-
11
-
12
-
13
-
14
-
15
-
16
-
17
-
18
-
19
-
20
-
21
-
22
-
23
-
24
-
25
-
26
-
27
-
28
-
29
-
30
-
31
-
32
-
33
-
34
-
35
-
36
-
37
-
38
-
39
-
40
-
41
-
42
-
43
-
44
-
45
-
46
-
47
-
48
-
49
-
50
-
51
-
52
-
53
-
54
-
55
-
56
-
57
-
58
-
59
-
60
-
61
-
62
-
63
-
64
-
65
-
66
-
67
-
68
-
69
-
70
-
71
-
72
-
73
-
74
-
75
-
76
-
77
-
78
-
79
-
80
-
81
-
82
-
83
-
84
-
85
-
86
-
87
-
88
-
89
-
 90
90 -
 91
91 -
 92
92 -
 93
93 -
 94
94 -
 95
95 -
 96
96 -
 97
97 -
 98
98 -
 99
99 -
 100
100 -
 101
101 -
 102
102 -
 103
103 -
 104
104 -
 105
105 -
 106
106 -
 107
107 -
 108
108 -
 109
109 -
 110
110 -
111
-
112
-
113
-
114
-
115
-
116
-
117
-
118
-
119
-
120
-
121
-
122
-
123
-
124
-
125
-
126
-
127
-
128
-
129
-
130
-
131
-
132
-
133
-
134
-
135
-
136
 |
 |

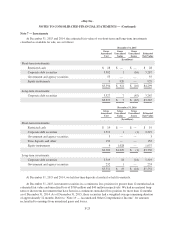
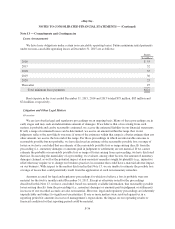
eBay Inc.
NOTES TO CONSOLIDATED FINANCIAL STATEMENTS — (Continued)
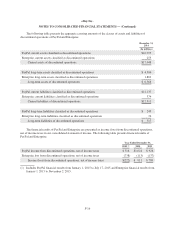
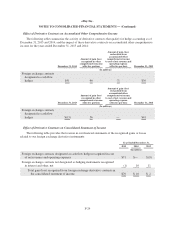
Description
Balances as of
December 31, 2014
Quoted Prices in
Active Markets for
Identical Assets
(Level 1)
Significant Other
Observable Inputs
(Level 2)
(In millions)
Assets:
Cash and cash equivalents $ 4,105 $1,694 $ 2,411
Short-term investments:
Restricted cash 19 19 —
Corporate debt securities 2,519 — 2,519
Government and agency securities 3 — 3
Time deposits 152 — 152
Equity instruments 1,037 1,037 —
Total short-term investments 3,730 1,056 2,674
Derivatives 84 — 84
Long-term investments:
Corporate debt securities 5,319 — 5,319
Government and agency securities 233 — 233
Total long-term investments 5,552 — 5,552
Total financial assets $13,471 $2,750 $10,721
Liabilities:
Derivatives $ 20 $ — $ 20
Our financial assets and liabilities are valued using market prices on both active markets (level 1) and less
active markets (level 2). Level 1 instrument valuations are obtained from real-time quotes for transactions in
active exchange markets involving identical assets. Level 2 instrument valuations are obtained from readily
available pricing sources for comparable instruments, identical instruments in less active markets, or models
using market observable inputs. The majority of our derivative instruments are valued using pricing models that
take into account the contract terms as well as multiple inputs where applicable, such as equity prices, interest
rate yield curves, option volatility and currency rates. We did not have any transfers of financial instruments
between valuation levels during 2015 or 2014.
Cash and cash equivalents are short-term, highly liquid investments with original or remaining maturities of
three months or less when purchased and are comprised primarily of bank deposits, certificates of deposit and
commercial paper.
In addition, we had cost and equity method investments of approximately $124 million and $184 million
included in long-term investments on our consolidated balance sheet at December 31, 2015 and 2014,
respectively.
Our derivative instruments vary in duration depending on contract type. Our foreign exchange derivative
contracts are primarily short-term in nature, generally one month to one year in duration. Certain foreign
F-26