eBay 2015 Annual Report Download - page 45
Download and view the complete annual report
Please find page 45 of the 2015 eBay annual report below. You can navigate through the pages in the report by either clicking on the pages listed below, or by using the keyword search tool below to find specific information within the annual report.-
 1
1 -
2
-
3
-
4
-
5
-
6
-
7
-
8
-
9
-
10
-
11
-
12
-
13
-
14
-
15
-
16
-
17
-
18
-
19
-
20
-
21
-
22
-
23
-
24
-
25
-
26
-
27
-
28
-
29
-
30
-
31
-
32
-
33
-
34
-
 35
35 -
 36
36 -
 37
37 -
 38
38 -
 39
39 -
 40
40 -
 41
41 -
 42
42 -
 43
43 -
 44
44 -
 45
45 -
 46
46 -
 47
47 -
 48
48 -
 49
49 -
 50
50 -
 51
51 -
 52
52 -
 53
53 -
 54
54 -
 55
55 -
56
-
57
-
58
-
59
-
60
-
61
-
62
-
63
-
64
-
65
-
66
-
67
-
68
-
69
-
70
-
71
-
72
-
73
-
74
-
75
-
76
-
77
-
78
-
79
-
80
-
81
-
82
-
83
-
84
-
85
-
86
-
87
-
88
-
89
-
90
-
91
-
92
-
93
-
94
-
95
-
96
-
97
-
98
-
99
-
100
-
101
-
102
-
103
-
104
-
105
-
106
-
107
-
108
-
109
-
110
-
111
-
112
-
113
-
114
-
115
-
116
-
117
-
118
-
119
-
120
-
121
-
122
-
123
-
124
-
125
-
126
-
127
-
128
-
129
-
130
-
131
-
132
-
133
-
134
-
135
-
136
 |
 |

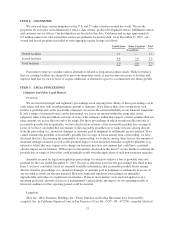
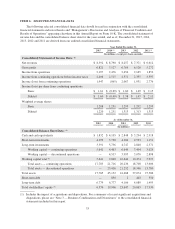
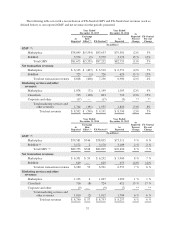
ITEM 6: SELECTED FINANCIAL DATA
The following selected consolidated financial data should be read in conjunction with the consolidated
financial statements and notes thereto and “Management’s Discussion and Analysis of Financial Condition and
Results of Operations” appearing elsewhere in this Annual Report on Form 10-K. The consolidated statement of
income data and the consolidated balance sheet data for the years ended, and as of, December 31, 2015, 2014,
2013, 2012 and 2011 are derived from our audited consolidated financial statements.
Year Ended December 31,
2015 2014 (2) 2013 2012 2011 (3)
(In millions, except per share amounts)
Consolidated Statement of Income Data: (1)
Net revenues $ 8,592 $ 8,790 $ 8,257 $ 7,371 $ 6,612
Gross profit 6,821 7,127 6,765 6,126 5,272
Income from operations 2,197 2,476 2,454 2,165 1,852
Income from continuing operations before income taxes 2,406 2,515 2,571 2,355 3,397
Income (loss) from continuing operations 1,947 (865) 2,067 1,931 2,776
Income (loss) per share from continuing operations:
Basic $ 1.61 $ (0.69) $ 1.60 $ 1.49 $ 2.15
Diluted $ 1.60 $ (0.69) $ 1.58 $ 1.47 $ 2.11
Weighted average shares:
Basic 1,208 1,251 1,295 1,292 1,293
Diluted 1,220 1,251 1,313 1,313 1,313
As of December 31,
2015 2014 2013 2012 2011
(In millions)
Consolidated Balance Sheet Data: (1)
Cash and cash equivalents $ 1,832 $ 4,105 $ 2,848 $ 5,294 $ 2,918
Short-term investments 4,299 3,730 4,204 2,533 1,151
Long-term investments 3,391 5,736 4,747 2,848 2,371
Working capital — continuing operations 5,641 4,463 6,649 7,404 3,029
Working capital — discontinued operations — 4,537 3,995 3,070 2,898
Working capital total (4) 5,641 9,000 10,644 10,474 5,927
Total assets — continuing operations 17,785 21,716 20,236 18,708 13,606
Total assets — discontinued operations — 23,416 21,252 18,366 13,780
Total assets 17,785 45,132 41,488 37,074 27,386
Short-term debt — 850 2 402 550
Long-term debt 6,779 6,777 4,106 4,089 1,495
Total stockholders’ equity (5) 6,576 19,906 23,647 20,865 17,930
(1) Includes the impact of acquisitions and dispositions. For a summary of recent significant acquisitions and
dispositions, please see “Note 3 — Business Combinations and Divestitures” to the consolidated financial
statements included in this report.
33