eBay 2015 Annual Report Download - page 55
Download and view the complete annual report
Please find page 55 of the 2015 eBay annual report below. You can navigate through the pages in the report by either clicking on the pages listed below, or by using the keyword search tool below to find specific information within the annual report.-
 1
1 -
2
-
3
-
4
-
5
-
6
-
7
-
8
-
9
-
10
-
11
-
12
-
13
-
14
-
15
-
16
-
17
-
18
-
19
-
20
-
21
-
22
-
23
-
24
-
25
-
26
-
27
-
28
-
29
-
30
-
31
-
32
-
33
-
34
-
35
-
36
-
37
-
38
-
39
-
40
-
41
-
42
-
43
-
44
-
 45
45 -
 46
46 -
 47
47 -
 48
48 -
 49
49 -
 50
50 -
 51
51 -
 52
52 -
 53
53 -
 54
54 -
 55
55 -
 56
56 -
 57
57 -
 58
58 -
 59
59 -
 60
60 -
 61
61 -
 62
62 -
 63
63 -
 64
64 -
 65
65 -
66
-
67
-
68
-
69
-
70
-
71
-
72
-
73
-
74
-
75
-
76
-
77
-
78
-
79
-
80
-
81
-
82
-
83
-
84
-
85
-
86
-
87
-
88
-
89
-
90
-
91
-
92
-
93
-
94
-
95
-
96
-
97
-
98
-
99
-
100
-
101
-
102
-
103
-
104
-
105
-
106
-
107
-
108
-
109
-
110
-
111
-
112
-
113
-
114
-
115
-
116
-
117
-
118
-
119
-
120
-
121
-
122
-
123
-
124
-
125
-
126
-
127
-
128
-
129
-
130
-
131
-
132
-
133
-
134
-
135
-
136
 |
 |

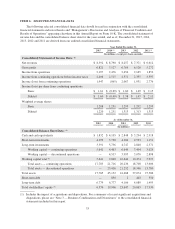
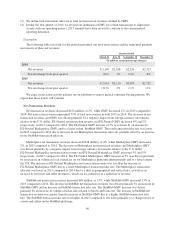
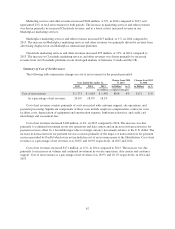
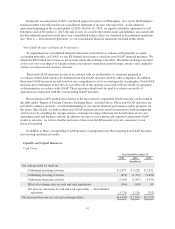
Summary of Operating Expenses, Interest and Other, net, and Provision for Income Taxes
The following table summarizes changes in operating expenses, interest and other, net and provision for
income taxes for the periods presented:
Year Ended December 31,
Change from
2014 to 2015
Change from
2013 to 2014
2015 2014 2013 in Dollars in % in Dollars in %
(In millions, except percentage changes)
Sales and marketing $2,267 $2,442 $2,144 $(175) (7)% $298 14 %
Product development 923 983 915 (60) (6)% 68 7 %
General and administrative 1,122 889 880 233 26 % 9 1 %
Provision for transaction losses 271 262 236 9 3 % 26 11 %
Amortization of acquired intangible assets 41 75 136 (34) (45)% (61) (45)%
Interest and other, net 209 39 117 170 436 % (78) (67)%
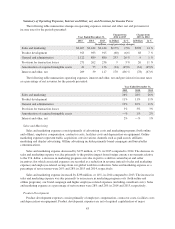
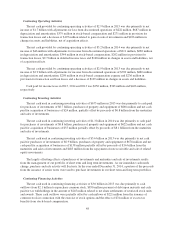
The following table summarizes operating expenses, interest and other, net and provision for income taxes
as a percentage of net revenues for the periods presented:
Year Ended December 31,
2015 2014 2013
Sales and marketing 26% 28% 26%
Product development 11% 11% 11%
General and administrative 13% 10% 11%
Provision for transaction losses 3% 3% 3%
Amortization of acquired intangible assets —% 1% 2%
Interest and other, net 2% —% 1%
Sales and Marketing
Sales and marketing expenses consist primarily of advertising costs and marketing programs (both online
and offline), employee compensation, contractor costs, facilities costs and depreciation on equipment. Online
marketing expenses represent traffic acquisition costs in various channels such as paid search, affiliates
marketing and display advertising. Offline advertising includes primarily brand campaigns and buyer/seller
communications.
Sales and marketing expense decreased by $175 million, or 7%, in 2015 compared to 2014. The decrease in
sales and marketing expense was due primarily to the positive impact from foreign currency movements relative
to the U.S. dollar, a decrease in marketing program costs due in part to a shift in certain buyer and seller
incentives (for which associated expenses are recorded as a reduction in revenue instead of sales and marketing
expense) and employee-related savings from our global workforce reduction. Sales and marketing expense as a
percentage of net revenues were 26% and 28% in 2015 and 2014, respectively.
Sales and marketing expense increased by $298 million, or 14%, in 2014 compared to 2013. The increase in
sales and marketing expense was due primarily to an increase in marketing program costs (both online and
offline programs), our brand campaign and higher employee-related expenses (including consultant costs). Sales
and marketing expense as a percentage of net revenues were 28% and 26% in 2014 and 2013, respectively.
Product Development
Product development expenses consist primarily of employee compensation, contractor costs, facilities costs
and depreciation on equipment. Product development expenses are net of required capitalization of major
43