Whirlpool 2014 Annual Report Download - page 21
Download and view the complete annual report
Please find page 21 of the 2014 Whirlpool annual report below. You can navigate through the pages in the report by either clicking on the pages listed below, or by using the keyword search tool below to find specific information within the annual report.-
 1
1 -
2
-
3
-
4
-
5
-
6
-
7
-
8
-
9
-
10
-
 11
11 -
 12
12 -
 13
13 -
 14
14 -
 15
15 -
 16
16 -
 17
17 -
 18
18 -
 19
19 -
 20
20 -
 21
21 -
 22
22 -
 23
23 -
 24
24 -
 25
25 -
 26
26 -
 27
27 -
 28
28
 |
 |

Whirlpool 2014AR p 38 / 39
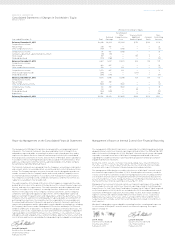
FREE CASH FLOW
As defined by the company, free cash flow is cash provided by operating activities after capi-
tal expenditures, proceeds from the sale of assets and businesses and changes in restricted
cash. The reconciliation provided below reconciles twelve-month 2014, 2013 and 2012 full-
year free cash flow with cash provided by operating activities, the most directly comparable
GAAP financial measure. The change in restricted cash relates to the private placement
funds paid by Whirlpool to acquire a majority control of Hefei Sanyo and which are used to
fund capital and technical resources to enhance Hefei Sanyo’s research and development
and working capital.
(Millions of dollars)
2014 2013 2012
Cash Provided by Operating Activities $ 1,479 $1,262 $ 696
Capital expenditures, proceeds from sale of assets/businesses
and changes in restricted cash (625)(572)(466)
Free Cash Flow $ 854 $ 690 $ 230
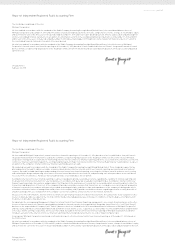
FORWARD-LOOKING STATEMENTS
The Private Securities Litigation Reform Act of 1995 provides a safe harbor for forward-
looking statements made by us or on our behalf. Certain statements contained in this annual
report, including those within the forward-looking perspective section within this Manage-
ment’s Discussion and Analysis, and other written and oral statements made from time to
time by us or on our behalf do not relate strictly to historical or current facts and may con-
tain forward-looking statements that reflect our current views with respect to future events
and financial performance. As such, they are considered “forward-looking statements” which
provide current expectations or forecasts of future events. Such statements can be identified
by the use of terminology such as “may,” “could,” “will,” “should,” “possible,” “plan,” “predict,”
“forecast,” “potential,” “anticipate,” “estimate,” “expect,” “project,” “intend,” “believe,” “may
impact,” “on track,” and similar words or expressions. Our forward-looking statements gen-
erally relate to our growth strategies, financial results, product development, and sales
efforts. These forward-looking statements should be considered with the understanding
that such statements involve a variety of risks and uncertainties, known and unknown, and
may be affected by inaccurate assumptions. Consequently, no forward-looking statement
can be guaranteed and actual results may vary materially.
This document contains forward-looking statements about Whirlpool Corporation and its
consolidated subsidiaries (“Whirlpool”) that speak only as of this date. Whirlpool disclaims
any obligation to update these statements. Forward-looking statements in this document
may include, but are not limited to, statements regarding expected earnings per share,
cash flow, productivity and raw material prices. Many risks, contingencies and uncertainties
could cause actual results to differ materially from Whirlpool’s forward-looking statements.
Among these factors are: (1) intense competition in the home appliance industry reflecting
the impact of both new and established global competitors, including Asian and European
manufacturers; (2) acquisition and investment-related risk, including risk associated with
our acquisitions of Hefei Sanyo and Indesit, and risk associated with our increased presence
in emerging markets; (3) Whirlpool’s ability to continue its relationship with significant trade
customers and the ability of these trade customers to maintain or increase market share;
(4) risks related to our international operations, including changes in foreign regulations,
regulatory compliance and disruptions arising from natural disasters or terrorist attacks;
(5) fluctuations in the cost of key materials (including steel, plastic, resins, copper and alu-
minum) and components and the ability of Whirlpool to offset cost increases; (6) the ability
of Whirlpool to manage foreign currency fluctuations; (7) litigation, tax, and legal compliance
risk and costs, especially costs which may be materially different from the amount we expect
to incur or have accrued for; (8) the effects and costs of governmental investigations or
related actions by third parties; (9) changes in the legal and regulatory environment including
environmental and health and safety regulations; (10) Whirlpool’s ability to maintain its repu-
tation and brand image; (11) the ability of Whirlpool to achieve its business plans, productivity
improvements, cost control, price increases, leveraging of its global operating platform,
and acceleration of the rate of innovation; (12) information technology system failures and
data security breaches; (13) product liability and product recall costs; (14) inventory and
other asset risk; (15) changes in economic conditions which affect demand for our products,
including the strength of the building industry and the level of interest rates; (16) the ability
of suppliers of critical parts, components and manufacturing equipment to deliver sufficient
quantities to Whirlpool in a timely and cost-effective manner; (17) the uncertain global econ-
omy; (18) our ability to attract, develop and retain executives and other qualified employees;
(19) the impact of labor relations; (20) Whirlpool’s ability to obtain and protect intellectual
property rights; and (21) health care cost trends, regulatory changes and variations between
results and estimates that could increase future funding obligations for pension and post-
retirement benefit plans.
We undertake no obligation to update any forward-looking statement, and investors are
advised to review disclosures in our filings with the SEC. It is not possible to foresee or
identify all factors that could cause actual results to differ from expected or historic results.
Therefore, investors should not consider the foregoing factors to be an exhaustive statement
of all risks, uncertainties, or factors that could potentially cause actual results to differ from
forward-looking statements.
Additional information concerning these and other factors can be found in Whirlpool
Corporation’s filings with the Securities and Exchange Commission, including the most
recent annual report on Form 10-K, quarterly reports on Form 10-Q and current reports
on Form 8-K.
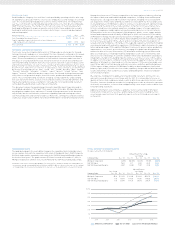
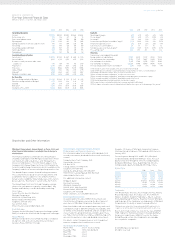
PERFORMANCE GRAPH
The graph below depicts the yearly dollar change in the cumulative total stockholder return
on our common stock with the cumulative total return of Standard & Poor’s [S&P] Composite
500 Stock Index and the cumulative total return of the S&P 500 Household Durables Index for
the last five fiscal years.* The graph assumes $100 was invested on December 31, 2009, in
Whirlpool Corporation common stock, the S&P 500 and the S&P Household Durables Index.
* Cumulative total return is measured by dividing [1] the sum of [a] the cumulative amount of the dividends for the
measurement period, assuming dividend reinvestment, and [b] the difference between share price at the end and
at the beginning of the measurement period by [2] the share price at the beginning of the measurement period.
TOTAL RETURN TO SHAREHOLDERS
(Includes reinvestment of dividends)
Annual Return Percentage
Years Ending
Company/Index Dec. ’10 Dec. ’11 Dec. ’12 Dec. ’13 Dec. ’14
Whirlpool Corporation 12.45% (45.00)% 120.12% 57.00% 25.81%
S&P 500 Index 15.06 2.11 16.00 32.39 13.69
S&P 500 Household Durables 22.87 (2.88) 71.57 31.08 18.54
Base Period
Indexed Returns
Years Ending
Company/Index Dec. ’09 Dec. ’10 Dec. ’11 Dec. ’12 Dec. ’13 Dec. ’14
Whirlpool Corporation $100 $112.45 $ 61.85 $136.14 $213.74 $268.90
S&P 500 Index 100 115.06 117.49 136.30 180.44 205.14
S&P 500 Household Durables 100 122.87 119.33 204.74 268.37 318.13
WHIRLPOOL CORPORATION S&P 500 INDEX S&P 500 HOUSEHOLD DURABLES
2009
0
50
100
150
200
250
300
$350
2010 2011 2012 2013 2014