Whirlpool 2014 Annual Report Download - page 20
Download and view the complete annual report
Please find page 20 of the 2014 Whirlpool annual report below. You can navigate through the pages in the report by either clicking on the pages listed below, or by using the keyword search tool below to find specific information within the annual report.
Whirlpool 2014AR p 36 / 37
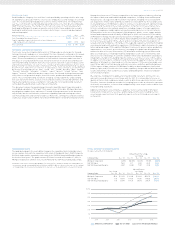
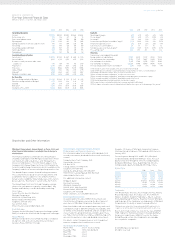
FINANCIAL SUMMARY
The following pages include Whirlpool Corporation’s financial condition and results of
operations for 2014, 2013 and 2012. For a more complete understanding of our financial
condition and results, this summary should be read together with Whirlpool Corporation’s
Financial Statements and related notes, and “Management’s Discussion and Analysis.” This
information appears in the Company’s 2014 Annual Report on Form 10-K filed with the
Securities and Exchange Commission, which is available on the company’s website at
investors.whirlpoolcorp.com/sec.cfm.
FORWARD-LOOKING PERSPECTIVE
We currently estimate earnings per diluted share and industry demand for 2015 and target
earnings per diluted share for 2018 to be within the following ranges:
2015
Current Outlook
2018
Target
Estimated earnings per diluted share,
for the year ending December 31, 2015 $10.75–$11.75 $21.50–$23.50
Including:
Restructuring Expense $(2.85) $(0.50)
Acquisition Related Transition Cost $(0.24) —
Pension Settlement Charge $(0.11) —
Acquisition Purchase Price Accounting Adjustment—Inventory $(0.01) —
Industry demand
North America +4% – +6%
Latin America (3)% – +0%
EMEA 0% – +2%
Asia +1% – +3%
For the full-year 2015, we expect to generate free cash flow between $700 and $800 million,
including restructuring cash outlays of up to $250 million, capital spending of $800 to
$850 million and U.S. pension contributions of approximately $80 million.
The projections above are based on many estimates and are inherently subject to change
based on future decisions made by management and the Board of Directors of Whirlpool,
and significant economic, competitive and other uncertainties and contingencies.
The table below reconciles projected 2015 and targeted 2018 cash provided by operating
activities determined in accordance with GAAP to free cash flow, a non-GAAP measure.
Management believes that free cash flow provides stockholders with a relevant measure of
liquidity and a useful basis for assessing Whirlpool’s ability to fund its activities and obliga-
tions. There are limitations to using non-GAAP financial measures, including the difficulty
associated with comparing companies that use similarly named non-GAAP measures whose
calculations may differ from our calculations. We define free cash flow as cash provided by
continuing operations less capital expenditures and including proceeds from the sale of
assets/businesses, and changes in restricted cash. The change in restricted cash relates
to the private placement funds paid by Whirlpool to acquire majority control of Hefei Sanyo
and which are used to fund capital and technical resources to enhance Hefei Sanyo’s
research and development and working capital.
(Millions of dollars)
2015
Current Outlook
2018
Target
Cash provided by operating activities $1,500–$1,650 $2,275–$2,625
Capital expenditures, proceeds from sale of assets/businesses
and changes in restricted cash (800)–(850) (975)–(1,025)
Free cash flow $700–$800 $1,300–$1,600
ONGOING BUSINESS OPERATIONS MEASURES: OPERATING PROFIT AND
EARNINGS PER DILUTED SHARE
The reconciliation provided below reconciles the non-GAAP financial measures, ongoing
business operating profit and ongoing business earnings per diluted share, with the most
directly comparable GAAP financial measures, reported operating profit and earnings per
diluted share avail able to Whirlpool, for the twelve months ended December 31, 2014,
December 31, 2013, and December 31, 2012. Ongoing business operating profit margin is
calculated by dividing ongoing business operating profit by adjusted net sales. Ongoing busi-
ness net sales excludes Brazilian (BEFIEX) tax credits from reported net sales. For more
information, see document titled “GAAP Reconciliations” at investors.whirlpoolcorp.com/
annuals.cfm.
Twelve Months Ended December 31,
Operating
Profit
Earnings Per
Diluted Share
(Millions of dollars, except per share data)
2014 2013 2012 2014 2013 2012
Reported GAAP measure $ 1,188 $ 1,249 $ 869 $ 8.17 $ 10.24 $ 5.06
Restructuring expense 136 196 237 1.34 1.84 2.15
Brazilian tax credits [BEFIEX] (14) (109) (37) (0.18) (1.35) (0.47)
Combined Acquisition Related Transition costs 98 — — 1.09 — —
U.S. Energy Tax Credits —— — —(1.56) —
Inventory Purchase Price Allocations 13 — — 0.13 — —
Antitrust and Contract resolutions 2— — 0.04 0.40 —
Brazilian collection dispute and antitrust resolutions —— — —— 0.32
Investment expense 52 6 — 0.86 0.19 —
Brazilian government settlement —11 — —0.26 —
Investment and intangible impairment —— 4 —— 0.12
Benefit plan curtailment gain —— (49) —— (0.38)
Contract and patent resolutions —— — —— 0.17
Normalized tax rate adjustment —— — (0.06) — 0.08
Ongoing business operations measure $ 1,475 $ 1,353 $ 1,024 $ 11.39 $ 10.02 $ 7.05
World’s Most Admired Companies
Fourth consecutive distinction from
Fortune
magazine
(Home Equipment, Furnishings Industry sector)
World’s Most Reputable Companies
Seventh consecutive honor from
Forbes
magazine and
the Reputation Institute
FTSE4Good Index
Global responsible investment index
Dow Jones Sustainability Index, North America
Global corporate sustainability index
Top 50 Best Corporate Citizens
Twelfth consecutive inclusion in
CR
magazine listing
(United States)
Best Places to Work for LGBT Equality
Eleventh perfect score of 100 from the Human Rights
Campaign (United States)
Best Customer Satisfaction
First among all major appliance companies from
American Customer Service Index
Top Company for Leaders
Ninth in North America and thirteenth globally from
Aon Hewitt
Leadership in Energy and Environmental Design
(LEED®) Silver Certification
Benton Harbor, Mich., Global Headquarters facility
Leadership in Energy and Environmental Design
(LEED®) Gold Certification
Benton Harbor, Mich., Riverview campus, Bldg. C—
U.S. Green Building Council
ENERGY STAR® Sustained Excellence Award
Whirlpool Canada—Natural Resources Canada
Green Rankings
Sixth in consumer products from
Newsweek
magazine
Melhores e Maiores/Biggest and Best Company in
Electronics
Exame
magazine (Brazil)
10 Most Innovative Organizations
Best Innovator ranking, A.T. Kearney together with
Época Negócios
magazine (Brazil)
20 Most Sustainable Companies
Fourth recognition by
Exame
magazine (Brazil)
25 Most Admired Companies
Recognized by human resources professionals in
Gestão RH
magazine (Brazil)
Great Place to Work
Época Negócios
magazine (Brazil)
Best Companies to Work For
Recognized by
Você S/A
magazine and the Institute of
Administration (Brazil)
Companies that Most Respect Consumers in Brazil
Consumidor Moderno
magazine (Brazil)
100 Companies with Best Reputation in Brazil
Exame
magazine (Brazil)
At Whirlpool Corporation, we’ve learned that hard work and doing the
right things the right way for 103 years pave the path for success.
We are humbled by the recognition from well-respected organizations
for our leadership in reputation, citizenship, sustainability and
innovation. 2014 awards include:
Corporate Recognition


