Unilever 1998 Annual Report Download - page 20
Download and view the complete annual report
Please find page 20 of the 1998 Unilever annual report below. You can navigate through the pages in the report by either clicking on the pages listed below, or by using the keyword search tool below to find specific information within the annual report.-
 1
1 -
2
-
3
-
4
-
5
-
6
-
7
-
8
-
9
-
 10
10 -
 11
11 -
 12
12 -
 13
13 -
 14
14 -
 15
15 -
 16
16 -
 17
17 -
 18
18 -
 19
19 -
 20
20 -
 21
21 -
 22
22 -
 23
23 -
 24
24 -
 25
25 -
 26
26 -
 27
27 -
 28
28 -
 29
29 -
 30
30 -
31
-
32
-
33
-
34
-
35
-
36
-
37
-
38
-
39
-
40
-
41
-
42
-
43
-
44
-
45
-
46
-
47
-
48
-
49
-
50
-
51
-
52
 |
 |

Unilever-groep
Toelichting op de geconsolideerde jaarrekening
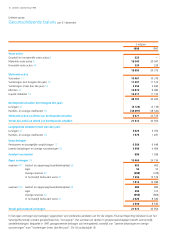
20 Gestort en opgevraagd aandelenkapitaal (vervolg)
Aandelenopties
Optierechten op gewone aandelen NV en PLC, verleend aan leden van de raden van bestuur en werknemers en uitstaande op 31 december 1998:
Periode mogelijke
Aantal Optiekoersen uitoefening
aandelen per aandeel optierechten
NV Executive Share Option Scheme 123 532 ƒ 48,00 - ƒ 51,27 1999
(Aandelen van ƒ 1) 403 660 ƒ 50,30 - ƒ 56,62 1999 - 2000
588 552 ƒ 58,52 - ƒ 71,62 1999 - 2001
345 224 ƒ 94,30 1999 - 2002
532 946 ƒ 143,20 - ƒ 152,70 1999 - 2003
(Aandelen van 1,25p) 2 282 940 £4,07 1999 - 2002
3 508 977 £6,09 - £6,68 1999 - 2003
North American Executive Stock Option Plan 48 800 US $ 25,69 1999 - 2002
(Aandelen van ƒ 1 geregistreerd in New York) 122 536 US $ 26,81 1999 - 2003
229 116 US $ 25,67 1999 - 2004
303 682 US $ 31,60 - US $ 31,95 1999 - 2005
418 340 US $ 33,89 1999 - 2006
318 753 US $ 48,74 1999 - 2007
261 073 US $ 76,69 1999 - 2007
(Aandelen van 1,25p als American Depositary Receipts) 2 131 120 US $ 6,72 1999 - 2007
1 747 196 US $ 10,85 1999 - 2007
PLC 1985 Executive Share Option Schemes 128 208 £1,62 - £1,66 1999
(Aandelen van 1,25p) 107 440 £1,83 - £1,84 1999 - 2000
391 524 £2,07 - £2,27 1999 - 2001
494 048 £2,54 - £2,62 1999 - 2002
1 279 524 £2,54 - £2,83 1999 - 2003
1 694 544 £2,83 - £2,98 1999 - 2004
893 464 £3,07 1999 - 2005
1 397 680 £3,08 1999 - 2005
721 800 £3,43 1999 - 2006
27 660 £4,07 2000 - 2006
6 620 £4,53 2000 - 2007
300 952 £6,68 - £6,79 2001 - 2007
PLC International 1997 Executive Share Option Scheme 215 416 ƒ 94,30 2000 - 2006
(Aandelen van ƒ 1) 1 436 ƒ 109,38 2000 - 2007
329 476 ƒ 152,70 - ƒ 163,60 2001 - 2007
(Aandelen van 1,25p) 1 388 654 £4,07 2000 - 2006
2 656 £4,53 2000 - 2007
1 857 078 £6,68 - £6,79 2001 - 2007
NV Aandelenoptieplan 61 266 ƒ 50,87 1999
(Aandelen van ƒ 1) 69 064 ƒ 68,75 1999 - 2000
68 395 ƒ 94,75 1999 - 2001
268 962 ƒ 127,00 2003
North American Employee Stock Purchase Plan
(Aandelen van ƒ 1 geregistreerd in New York) 785 756 US $ 47,83 1999
PLC 1985 Sharesave Scheme 250 070 £2,28 1999
(Aandelen van 1,25p) 3 860 107 £2,29 1999 - 2000
5 953 667 £2,68 2000 - 2001
6 458 624 £2,78 2001 - 2002
9 274 219 £3,71 2002 - 2003
6 232 334 £5,94 2003 - 2004
20 Unilever Jaarrekening 1998