Toyota 2014 Annual Report Download - page 65
Download and view the complete annual report
Please find page 65 of the 2014 Toyota annual report below. You can navigate through the pages in the report by either clicking on the pages listed below, or by using the keyword search tool below to find specific information within the annual report.-
 1
1 -
2
-
3
-
4
-
5
-
6
-
7
-
8
-
9
-
10
-
11
-
12
-
13
-
14
-
15
-
16
-
17
-
18
-
19
-
20
-
21
-
22
-
23
-
24
-
25
-
26
-
27
-
28
-
29
-
30
-
31
-
32
-
33
-
34
-
35
-
36
-
37
-
38
-
39
-
40
-
41
-
42
-
43
-
44
-
45
-
46
-
47
-
48
-
49
-
50
-
51
-
52
-
53
-
54
-
 55
55 -
 56
56 -
 57
57 -
 58
58 -
 59
59 -
 60
60 -
 61
61 -
 62
62 -
 63
63 -
 64
64 -
 65
65 -
 66
66 -
 67
67 -
 68
68
 |
 |
ANNUAL REPORT 2014
President’s MessagePresident’s Message
Overview of
Four Business Units
Overview of
Four Business Units
Special FeatureSpecial Feature
Review of OperationsReview of Operations
Consolidated Performance
Highlights
Consolidated Performance
Highlights
Management and
Corporate Information
Management and
Corporate Information
Investor InformationInvestor Information
Financial SectionFinancial Section
Page 65
NextPrev
ContentsSearchPrint
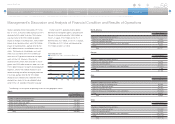
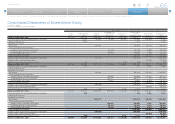
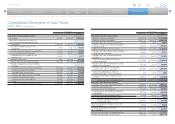
Consolidated Statements of Shareholders’ Equity
Toyota Motor Corporation
For the years ended March 31, 2012, 2013 and 2014
Yen in millions
Common
stock
Additional paid-in
capital
Retained
earnings
Accumulated other
comprehensive
income (loss)
Treasury stock,
at cost
Total Toyota Motor
Corporation
shareholders’ equity
Noncontrolling
interests
Total shareholders’
equity
Balances at March 31, 2011 397,050 505,760 11,835,665 (1,144,721) (1,261,383) 10,332,371 587,653 10,920,024
Equity transaction with noncontrolling interests and other 43,311 (45,365) (6,503) 125,819 117,262 (119,824) (2,562)
Issuance during the year 1,483 1,483 1,483
Comprehensive income
Net income 283,559 283,559 84,743 368,302
Other comprehensive income (loss)
Foreign currency translation adjustments (87,729) (87,729) (5,563) (93,292)
Unrealized gains (losses) on securities 129,328 129,328 2,466 131,794
Pension liability adjustments (69,208) (69,208) 4,098 (65,110)
Total comprehensive income 255,950 85,744 341,694
Dividends paid to Toyota Motor Corporation shareholders (156,785) (156,785) (156,785)
Dividends paid to noncontrolling interests (37,356) (37,356)
Repurchase and reissuance of treasury stock 96 (116) (20) (20)
Balances at March 31, 2012 397,050 550,650 11,917,074 (1,178,833) (1,135,680) 10,550,261 516,217 11,066,478
Equity transaction with noncontrolling interests and other 675 675 4,961 5,636
Issuance during the year
Comprehensive income
Net income 962,163 962,163 121,319 1,083,482
Other comprehensive income (loss)
Foreign currency translation adjustments 434,638 434,638 27,116 461,754
Unrealized gains (losses) on securities 368,507 368,507 5,702 374,209
Pension liability adjustments 19,565 19,565 (4,854) 14,711
Total comprehensive income 1,784,873 149,283 1,934,156
Dividends paid to Toyota Motor Corporation shareholders (190,008) (190,008) (190,008)
Dividends paid to noncontrolling interests (45,640) (45,640)
Repurchase and reissuance of treasury stock (285) (23) 2,542 2,234 2,234
Balances at March 31, 2013 397,050 551,040 12,689,206 (356,123) (1,133,138) 12,148,035 624,821 12,772,856
Equity transaction with noncontrolling interests and other 528 528 2,985 3,513
Issuance during the year
Comprehensive income
Net income 1,823,119 1,823,119 168,529 1,991,648
Other comprehensive income (loss)
Foreign currency translation adjustments 296,942 296,942 4,947 301,889
Unrealized gains (losses) on securities 493,750 493,750 5,810 499,560
Pension liability adjustments 93,592 93,592 5,812 99,404
Total comprehensive income 2,707,403 185,098 2,892,501
Dividends paid to Toyota Motor Corporation shareholders (396,030) (396,030) (396,030)
Dividends paid to noncontrolling interests (63,065) (63,065)
Repurchase and reissuance of treasury stock (260) 9,472 9,212 9,212
Balances at March 31, 2013 397,050 551,308 14,116,295 528,161 (1,123,666) 14,469,148 749,839 15,218,987
Selected Financial Summary (U.S. GAAP) Consolidated Segment Information Consolidated Quarterly Financial Summary Management’s Discussion and Analysis of Financial Condition and Results of Operations Consolidated Financial Statements [4 of 5]