Toyota 2014 Annual Report Download - page 53
Download and view the complete annual report
Please find page 53 of the 2014 Toyota annual report below. You can navigate through the pages in the report by either clicking on the pages listed below, or by using the keyword search tool below to find specific information within the annual report.-
 1
1 -
2
-
3
-
4
-
5
-
6
-
7
-
8
-
9
-
10
-
11
-
12
-
13
-
14
-
15
-
16
-
17
-
18
-
19
-
20
-
21
-
22
-
23
-
24
-
25
-
26
-
27
-
28
-
29
-
30
-
31
-
32
-
33
-
34
-
35
-
36
-
37
-
38
-
39
-
40
-
41
-
42
-
 43
43 -
 44
44 -
 45
45 -
 46
46 -
 47
47 -
 48
48 -
 49
49 -
 50
50 -
 51
51 -
 52
52 -
 53
53 -
 54
54 -
 55
55 -
 56
56 -
 57
57 -
 58
58 -
 59
59 -
 60
60 -
 61
61 -
 62
62 -
 63
63 -
64
-
65
-
66
-
67
-
68
 |
 |
ANNUAL REPORT 2014
President’s MessagePresident’s Message
Overview of
Four Business Units
Overview of
Four Business Units
Special FeatureSpecial Feature
Review of OperationsReview of Operations
Consolidated Performance
Highlights
Consolidated Performance
Highlights
Management and
Corporate Information
Management and
Corporate Information
Investor InformationInvestor Information
Financial SectionFinancial Section
Page 53
NextPrev
ContentsSearchPrint
Toyota’s net revenues include net revenues from
sales of products, consisting of net revenues from
automotive operations and all other operations,
which increased by 16.2% during fiscal 2014 com-
pared with the prior fiscal year to ¥24,312.6 billion,
and net revenues from financial services operations
which increased by 19.9% during fiscal 2014 com-
pared with the prior fiscal year to ¥1,379.2 billion.
Excluding the impact of changes in the Japanese
yen values used for translation purposes of
¥2,311.9 billion, net revenues from sales of
products would have been ¥22,000.6 billion during
fiscal 2014, a 5.2% increase compared with the
prior fiscal year. The increase in net revenues from
sales of products is mainly due to an increase in
Toyota vehicle unit sales of 245 thousand vehicles.
Excluding the impact of changes in the Japanese
yen values used for translation purposes of ¥198.5
billion, net revenues from financial services opera-
tions would have been ¥1,180.7 billion during fiscal
2014, a 2.7% increase compared with the prior fis-
cal year.
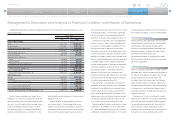
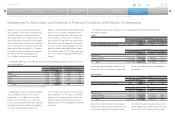
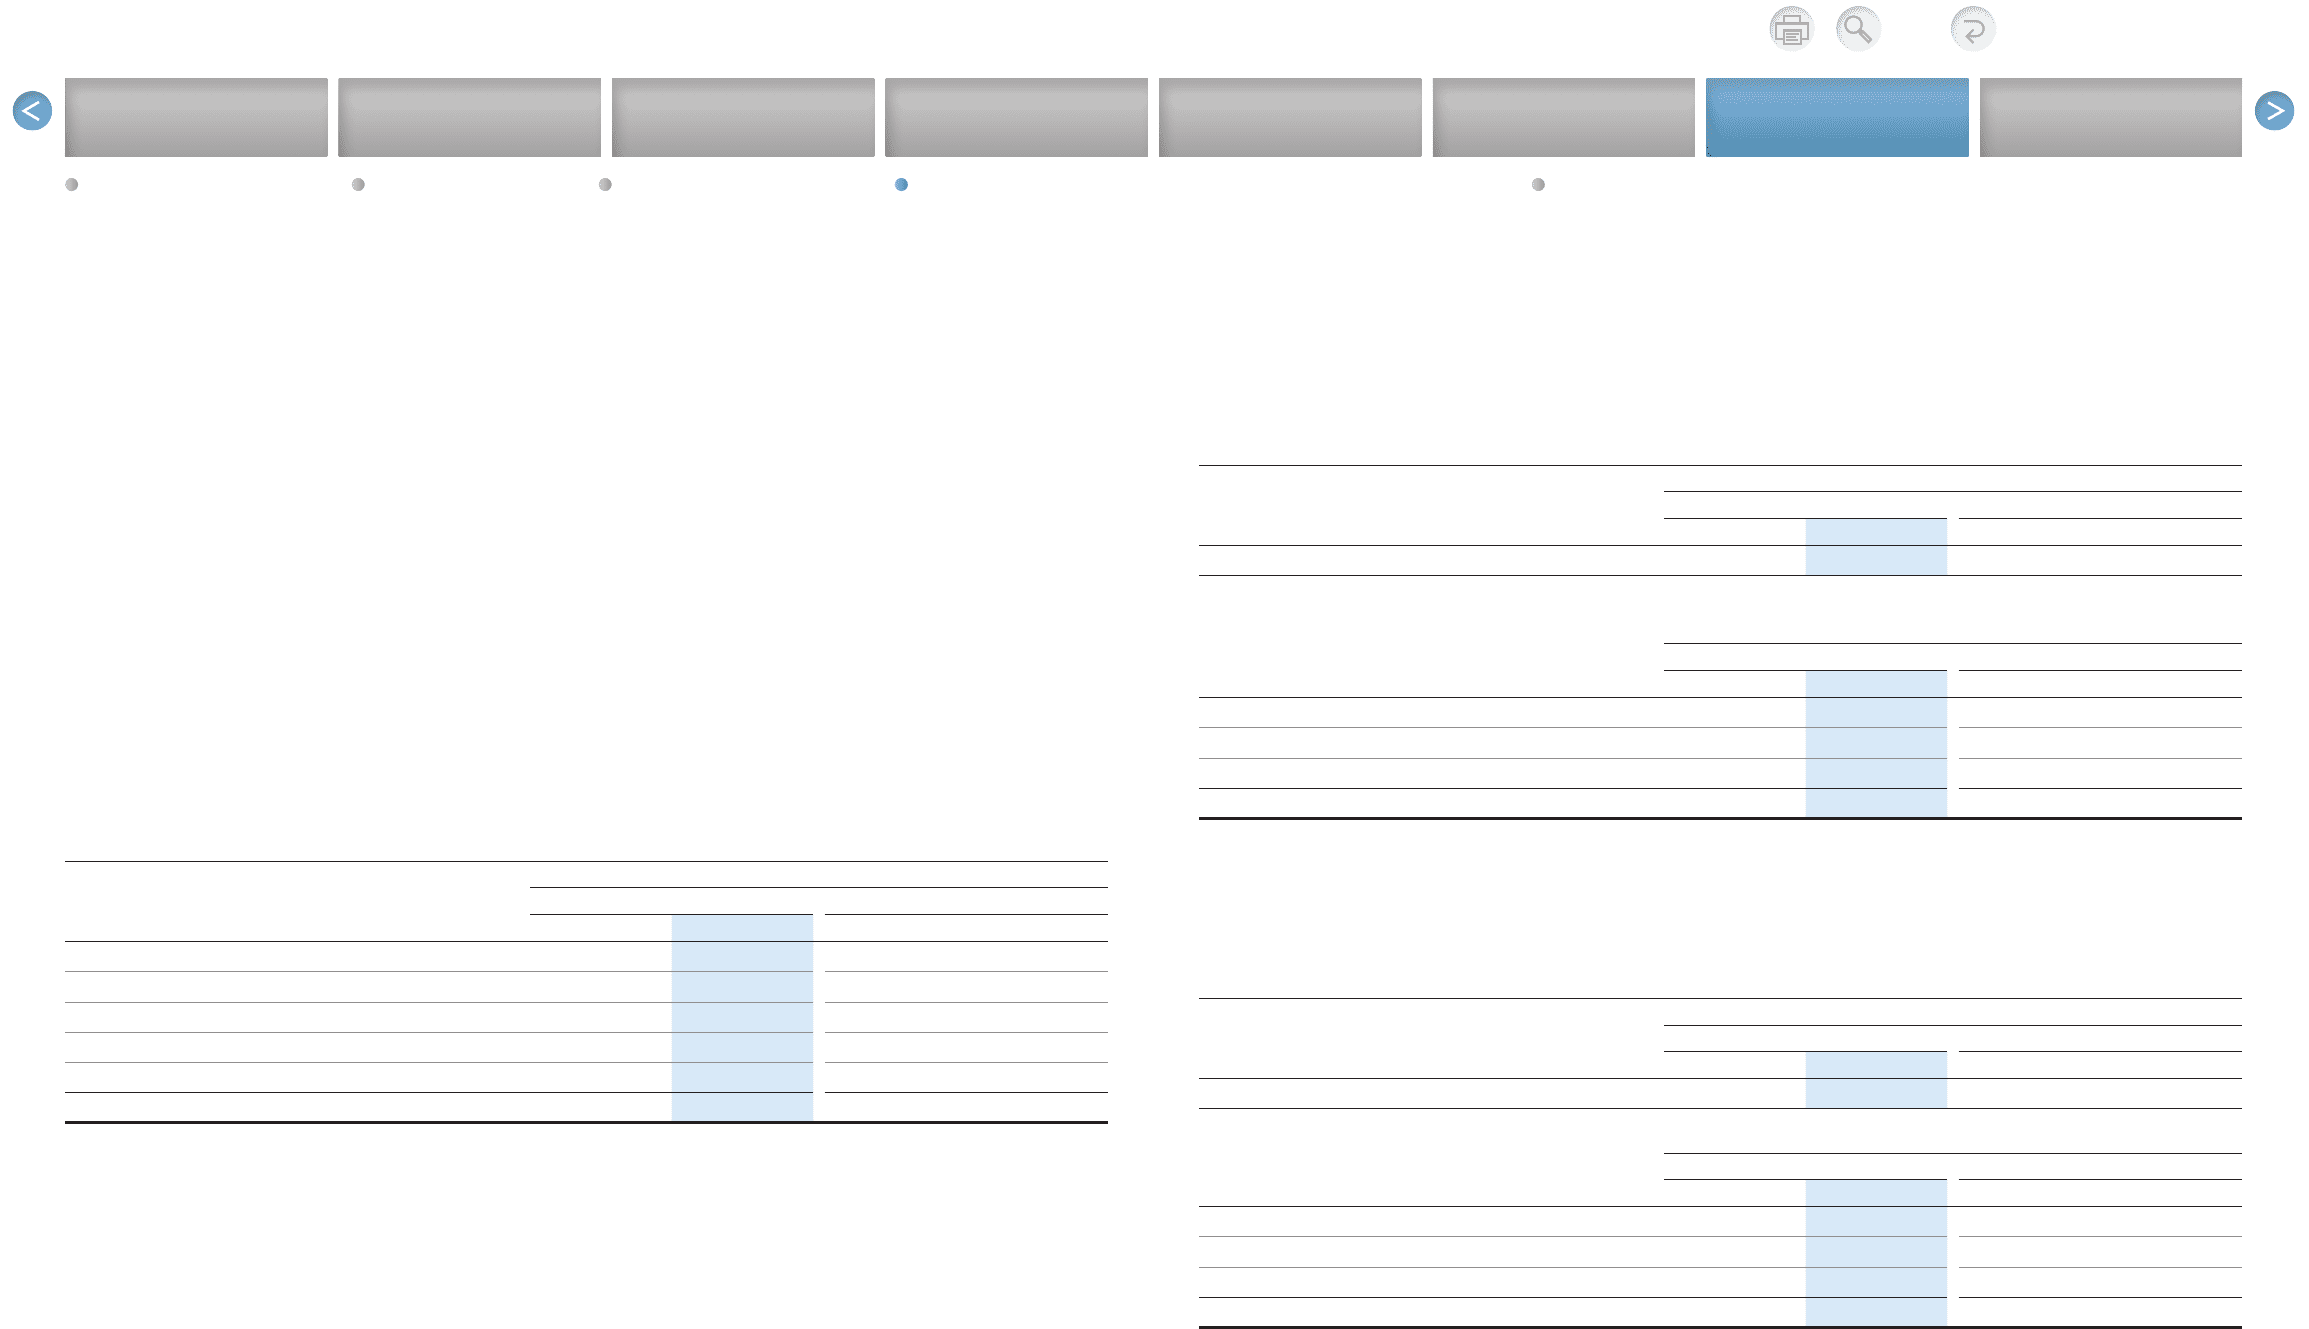
The following table shows the number of financing contracts by geographic region at the end of fiscal 2014
and 2013, respectively.
Number of financing contracts in thousands
Years ended March 31, 2014 vs. 2013 Change
2013 2014 Amount Percentage (%)
Japan 1,765 1,813 48 +2.7
North America 4,596 4,791 195 +4.3
Europe 825 879 54 +6.5
Asia 868 1,167 299 +34.5
Other* 618 688 70 +11.3
Total 8,672 9,338 666 +7.7
* “Other” consists of Central and South America, Oceania and Africa.
Geographically, net revenues (before the elimina-
tion of intersegment revenues) for fiscal 2014
increased by 11.5% in Japan, 29.2% in North
America, 30.8% in Europe, 11.2% in Asia, and
11.6% in Other compared with the prior fiscal year.
Excluding the impact of changes in the Japanese
yen values used for translation purposes of
¥2,510.4 billion, net revenues in fiscal 2014 would
have increased by 11.5% in Japan, 8.4% in North
America, 6.5% in Europe and 5.9% in Other com-
pared with the prior fiscal year, and would have
decreased by 4.9% in Asia compared with the prior
fiscal year.
The following is a discussion of net revenues in each geographic market (before the elimination of
intersegment revenues).
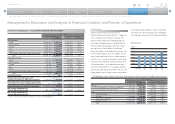
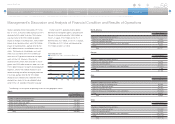
Japan
Thousands of units
Years ended March 31, 2014 vs. 2013 Change
2013 2014 Amount Percentage (%)
Toyota’s consolidated vehicle unit sales* 4,202 4,220 18 +0.4
* including number of exported vehicle unit sales
Yen in millions
Years ended March 31, 2014 vs. 2013 Change
2013 2014 Amount Percentage (%)
Net revenues:
Sales of products 12,687,092 14,179,710 1,492,618 +11.8
Financial services 133,926 117,760 (16,166) –12.1
Total 12,821,018 14,297,470 1,476,452 +11.5
Toyota’s domestic and exported vehicle unit sales
increased by 18 thousand vehicles compared with
the prior fiscal year due primarily to favorable mar-
ket conditions.
North America
Thousands of units
Years ended March 31, 2014 vs. 2013 Change
2013 2014 Amount Percentage (%)
Toyota’s consolidated vehicle unit sales 2,469 2,529 60 +2.5
Yen in millions
Years ended March 31, 2014 vs. 2013 Change
2013 2014 Amount Percentage (%)
Net revenues:
Sales of products 5,564,183 7,234,376 1,670,193 +30.0
Financial services 720,242 882,723 162,481 +22.6
Total 6,284,425 8,117,099 1,832,674 +29.2
Net revenues in North America increased due pri-
marily to the 60 thousand vehicles increase in vehi-
cle unit sales compared with the prior fiscal year.
The vehicle unit sales increased due mainly to the
market progressing in a steady manner and strong
sales of the RAV4, IS and other new car models.
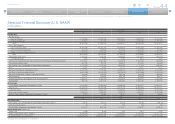
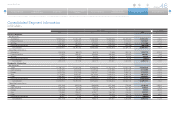
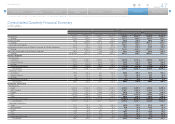
Management’s Discussion and Analysis of Financial Condition and Results of Operations
Selected Financial Summary (U.S. GAAP) Consolidated Segment Information Consolidated Quarterly Financial Summary Management’s Discussion and Analysis of Financial Condition and Results of Operations [6 of 14] Consolidated Financial Statements