Toyota 2014 Annual Report Download - page 55
Download and view the complete annual report
Please find page 55 of the 2014 Toyota annual report below. You can navigate through the pages in the report by either clicking on the pages listed below, or by using the keyword search tool below to find specific information within the annual report.-
 1
1 -
2
-
3
-
4
-
5
-
6
-
7
-
8
-
9
-
10
-
11
-
12
-
13
-
14
-
15
-
16
-
17
-
18
-
19
-
20
-
21
-
22
-
23
-
24
-
25
-
26
-
27
-
28
-
29
-
30
-
31
-
32
-
33
-
34
-
35
-
36
-
37
-
38
-
39
-
40
-
41
-
42
-
43
-
44
-
 45
45 -
 46
46 -
 47
47 -
 48
48 -
 49
49 -
 50
50 -
 51
51 -
 52
52 -
 53
53 -
 54
54 -
 55
55 -
 56
56 -
 57
57 -
 58
58 -
 59
59 -
 60
60 -
 61
61 -
 62
62 -
 63
63 -
 64
64 -
 65
65 -
66
-
67
-
68
 |
 |

ANNUAL REPORT 2014
President’s MessagePresident’s Message
Overview of
Four Business Units
Overview of
Four Business Units
Special FeatureSpecial Feature
Review of OperationsReview of Operations
Consolidated Performance
Highlights
Consolidated Performance
Highlights
Management and
Corporate Information
Management and
Corporate Information
Investor InformationInvestor Information
Financial SectionFinancial Section
Page 55
NextPrev
ContentsSearchPrint
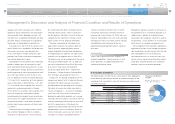
Operating costs and expenses increased by
¥2,656.4 billion, or 12.8%, to ¥23,399.7 billion dur-
ing fiscal 2014 compared with the prior fiscal year.
This increase resulted mainly from the ¥2,378.9 bil-
lion unfavorable impact of fluctuations in foreign
currency translation rates, the ¥447.5 billion
increase in miscellaneous costs and others, and the
¥120.0 billion impact of changes in vehicle unit
sales and sales mix, partially offset by the ¥290.0
billion impact of cost reduction efforts.
The increase in miscellaneous costs and others
was due mainly to the ¥125.0 billion payment to the
U.S. government based on the agreement with the
U.S. Attorney’s Office for the Southern District of
New York to resolve its investigation, the ¥100.0 bil-
lion increase in labor costs, the ¥100.0 billion
increase in research and development expenses,
and the ¥83.0 billion increase in costs related to
ending the vehicle and engine production in
Australia, partially offset by the ¥90.0 billion charge
for costs related to the settlement of the economic
loss claims in the consolidated federal action in the
U.S. recorded in the prior fiscal year.
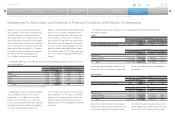
Cost Reduction Efforts
During fiscal 2014, Toyota’s continued cost reduc-
tion efforts reduced operating costs and expenses
by ¥290.0 billion. The amount of the effect of cost
reduction efforts includes the impact of fluctuation
in the price of steel, precious metals, non-ferrous
alloys including aluminum, plastic parts and other
production materials and parts. In fiscal
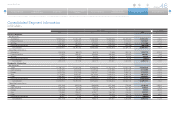
Cost of Financing Operations
Cost of financing operations increased by ¥182.4
billion, or 28.9%, to ¥812.8 billion during fiscal 2014
compared with the prior fiscal year. The increase
resulted mainly from the ¥183.0 billion unfavorable
impact of fluctuations in foreign currency translation
rates.
Selling, General and Administrative Expenses
Selling, general and administrative expenses
increased by ¥496.3 billion, or 23.6%, to ¥2,598.6
billion during fiscal 2014 compared with the prior
fiscal year. This increase mainly reflected the ¥329.3
billion unfavorable impact of fluctuations in foreign
currency translation rates, and the ¥125.0 billion
payment to the U.S. government based on the
agreement with the U.S. Attorney’s Office for the
2014, continued cost reduction efforts together with
suppliers contributed to the improvement in earn-
ings. These cost reduction efforts related to ongoing
value engineering and value analysis activities, the
use of common parts resulting in a reduction of part
types and other manufacturing initiatives designed
to reduce the costs of vehicle production.
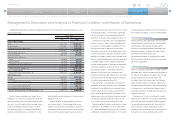
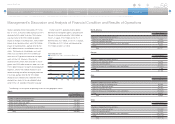
Cost of Products Sold
Cost of products sold increased by ¥1,977.6 billion,
or 11.0%, to ¥19,988.2 billion during fiscal 2014
compared with the prior fiscal year. The increase
resulted mainly from the ¥1,866.5 billion unfavorable
impact of fluctuations in foreign currency translation
rates, the ¥105.0 billion impact of changes in vehi-
cle unit sales and sales mix, the ¥100.0 billion
increase in research and development expenses,
and the ¥80.0 billion increase in costs related to
ending the vehicle and engine production in
Australia, partially offset by the ¥290.0 billion impact
of cost reduction efforts.
Southern District of New York to resolve its investi-
gation, partially offset by the ¥90.0 billion charge for
costs related to the settlement of the economic loss
claims in the consolidated federal action in the U.S.
recorded in the prior fiscal year.
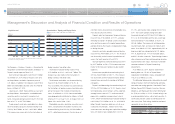
20,000
0
100
15,000 75
10,000 50
5,000 25
0
Cost of Products Sold
Cost of products sold % of net revenues (Right scale)
(¥ Billion)
FY
(%)
’10 ’11 ’12 ’13 ’14
1,000
0
5
800 4
600 3
2
200
400
1
0
R&D Expenses
R&D expenses % of net revenues (Right scale)
(¥ Billion)
FY
(%)
’10 ’11 ’12 ’13 ’14
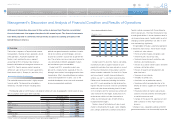
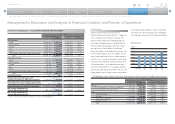
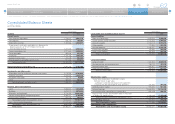
Yen in millions
2014 vs. 2013 Change
Changes in operating income and loss:
Effect of changes in exchange rates 900,000
Effect of cost reduction efforts 290,000
Effect of marketing efforts 180,000
Effect of increase of miscellaneous costs and others (480,000)
Other 81,224
Total 971,224
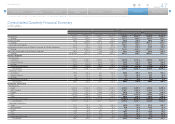
Management’s Discussion and Analysis of Financial Condition and Results of Operations
Selected Financial Summary (U.S. GAAP) Consolidated Segment Information Consolidated Quarterly Financial Summary Management’s Discussion and Analysis of Financial Condition and Results of Operations [8 of 14] Consolidated Financial Statements
Operating Income