Toyota 2014 Annual Report Download - page 62
Download and view the complete annual report
Please find page 62 of the 2014 Toyota annual report below. You can navigate through the pages in the report by either clicking on the pages listed below, or by using the keyword search tool below to find specific information within the annual report.-
 1
1 -
2
-
3
-
4
-
5
-
6
-
7
-
8
-
9
-
10
-
11
-
12
-
13
-
14
-
15
-
16
-
17
-
18
-
19
-
20
-
21
-
22
-
23
-
24
-
25
-
26
-
27
-
28
-
29
-
30
-
31
-
32
-
33
-
34
-
35
-
36
-
37
-
38
-
39
-
40
-
41
-
42
-
43
-
44
-
45
-
46
-
47
-
48
-
49
-
50
-
51
-
 52
52 -
 53
53 -
 54
54 -
 55
55 -
 56
56 -
 57
57 -
 58
58 -
 59
59 -
 60
60 -
 61
61 -
 62
62 -
 63
63 -
 64
64 -
 65
65 -
 66
66 -
 67
67 -
 68
68
 |
 |
ANNUAL REPORT 2014
President’s MessagePresident’s Message
Overview of
Four Business Units
Overview of
Four Business Units
Special FeatureSpecial Feature
Review of OperationsReview of Operations
Consolidated Performance
Highlights
Consolidated Performance
Highlights
Management and
Corporate Information
Management and
Corporate Information
Investor InformationInvestor Information
Financial SectionFinancial Section
Page 62
NextPrev
ContentsSearchPrint
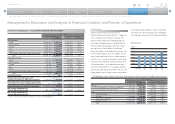
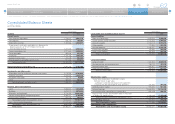
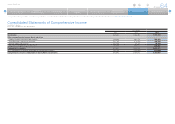
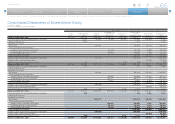
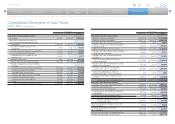
Consolidated Balance Sheets
Toyota Motor Corporation
March 31, 2013 and 2014
Yen in millions
ASSETS 2013 2014
Current assets
Cash and cash equivalents 1,718,297 2,041,170
Time deposits 106,700 180,207
Marketable securities 1,445,663 2,046,877
Trade accounts and notes receivable, less allowance for
doubtful accounts of ¥15,875 million in 2013 and
¥18,780 million in 2014 1,971,659 2,036,232
Finance receivables, net 5,117,660 5,628,934
Other receivables 432,693 351,182
Inventories 1,715,786 1,894,704
Deferred income taxes 749,398 866,386
Prepaid expenses and other current assets 527,034 672,014
Total current assets 13,784,890 15,717,706
Noncurrent finance receivables, net 6,943,766 8,102,294
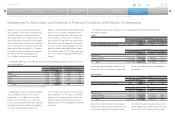
Investments and other assets
Marketable securities and other securities investments 5,176,582 6,765,043
Affiliated companies 2,103,283 2,429,778
Employees receivables 53,741 44,966
Other 569,816 736,388
Total investments and other assets 7,903,422 9,976,175
Property, plant and equipment
Land 1,303,611 1,314,040
Buildings 3,874,279 4,073,335
Machinery and equipment 9,716,180 10,381,285
Vehicles and equipment on operating leases 3,038,011 3,709,560
Construction in progress 291,539 286,571
Total property, plant and equipment, at cost 18,223,620 19,764,791
Less—Accumulated depreciation (11,372,381) (12,123,493)
Total property, plant and equipment, net 6,851,239 7,641,298
Total assets 35,483,317 41,437,473
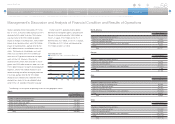
Yen in millions
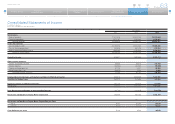
LIABILITIES AND SHAREHOLDERS’ EQUITY 2013 2014
Current liabilities
Short-term borrowings 4,089,528 4,830,820
Current portion of long-term debt 2,704,428 2,949,663
Accounts payable 2,113,778 2,213,218
Other payables 721,065 845,426
Accrued expenses 2,185,537 2,313,160
Income taxes payable 156,266 594,829
Other current liabilities 941,918 933,569
Total current liabilities 12,912,520 14,680,685
Long-term liabilities
Long-term debt 7,337,824 8,546,910
Accrued pension and severance costs 766,112 767,618
Deferred income taxes 1,385,927 1,811,846
Other long-term liabilities 308,078 411,427
Total long-term liabilities 9,797,941 11,537,801
Shareholders’ equity
Toyota Motor Corporation shareholders’ equity
Common stock, no par value,
authorized: 10,000,000,000 shares in 2013 and 2014;
issued: 3,447,997,492 shares in 2013 and 2014 397,050 397,050
Additional paid-in capital 551,040 551,308
Retained earnings 12,689,206 14,116,295
Accumulated other comprehensive income (loss) (356,123) 528,161
Treasury stock, at cost, 280,568,824 shares in 2013 and
278,231,473 shares in 2014 (1,133,138) (1,123,666)
Total Toyota Motor Corporation shareholders’ equity 12,148,035 14,469,148
Noncontrolling interests 624,821 749,839
Total shareholders’ equity 12,772,856 15,218,987
Commitments and contingencies
Total liabilities and shareholders’ equity 35,483,317 41,437,473
Selected Financial Summary (U.S. GAAP) Consolidated Segment Information Consolidated Quarterly Financial Summary Management’s Discussion and Analysis of Financial Condition and Results of Operations Consolidated Financial Statements [1 of 5]