Toyota 2014 Annual Report Download - page 57
Download and view the complete annual report
Please find page 57 of the 2014 Toyota annual report below. You can navigate through the pages in the report by either clicking on the pages listed below, or by using the keyword search tool below to find specific information within the annual report.-
 1
1 -
2
-
3
-
4
-
5
-
6
-
7
-
8
-
9
-
10
-
11
-
12
-
13
-
14
-
15
-
16
-
17
-
18
-
19
-
20
-
21
-
22
-
23
-
24
-
25
-
26
-
27
-
28
-
29
-
30
-
31
-
32
-
33
-
34
-
35
-
36
-
37
-
38
-
39
-
40
-
41
-
42
-
43
-
44
-
45
-
46
-
 47
47 -
 48
48 -
 49
49 -
 50
50 -
 51
51 -
 52
52 -
 53
53 -
 54
54 -
 55
55 -
 56
56 -
 57
57 -
 58
58 -
 59
59 -
 60
60 -
 61
61 -
 62
62 -
 63
63 -
 64
64 -
 65
65 -
 66
66 -
 67
67 -
68
 |
 |

ANNUAL REPORT 2014
President’s MessagePresident’s Message
Overview of
Four Business Units
Overview of
Four Business Units
Special FeatureSpecial Feature
Review of OperationsReview of Operations
Consolidated Performance
Highlights
Consolidated Performance
Highlights
Management and
Corporate Information
Management and
Corporate Information
Investor InformationInvestor Information
Financial SectionFinancial Section
Page 57
NextPrev
ContentsSearchPrint
Interest and dividend income increased by ¥16.7
billion, or 17.0%, to ¥115.4 billion during fiscal 2014
compared with the prior fiscal year.
Interest expense decreased by ¥3.3 billion, or
14.5%, to ¥19.6 billion during fiscal 2014 compared
with the prior fiscal year.
Foreign exchange gain, net increased by ¥44.7
billion, or 805.4%, to ¥50.2 billion during fiscal 2014
compared with the prior fiscal year. Foreign
exchange gains and losses include the differences
between the value of foreign currency denominated
assets and liabilities recognized through transac-
tions in foreign currencies translated at prevailing
exchange rates and the value at the date the trans-
action settled during the fiscal year, including those
settled using forward foreign currency exchange
contracts, or the value translated by appropriate
year-end exchange rates. The ¥44.7 billion increase
in foreign exchange gain, net was due mainly to the
losses recorded in fiscal 2013 resulting from the
Japanese yen being stronger against foreign cur-
rencies at the time foreign currency bonds were
redeemed during that fiscal year than the Japanese
yen at the time of purchase.
Other loss, net increased by ¥1.4 billion, or
94.7%, to ¥2.9 billion during fiscal 2014 compared
with the prior fiscal year.
The provision for income taxes increased by ¥216.1
billion, or 39.2%, to ¥767.8 billion during fiscal 2014
compared with the prior fiscal year due mainly to
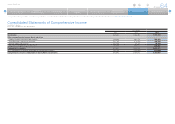
Other comprehensive income increased by ¥61.5
billion to ¥884.2 billion for fiscal 2014 compared
with the prior fiscal year. This increase resulted from
unrealized holding gains on securities in fiscal 2014
of ¥493.7 billion compared with gains of ¥368.5 bil-
lion in the prior fiscal year, and from pension liability
adjustments in fiscal 2014 of ¥93.5 billion com-
pared with gains of ¥19.5 billion in the prior fiscal
year, partially offset by unfavorable foreign currency
translation adjustments gains of ¥296.9 billion in fis-
cal 2014 compared with gains of ¥434.6 billion in
the prior fiscal year.
the increase in income before income taxes and
equity in earnings of affiliated companies. The effec-
tive tax rate for fiscal 2014 was 31.5%, which was
lower than the statutory tax rate in Japan. This was
due mainly to the increase in tax credits and income
before income taxes and equity in earnings of affili-
ated companies from foreign subsidiaries where
statutory tax rates are lower than that of Japan.
Net income attributable to noncontrolling interests
increased by ¥47.2 billion, or 38.9%, to ¥168.5 bil-
lion during fiscal 2014 compared with the prior fiscal
year. This was due mainly to an increase during fis-
cal 2014 in net income attributable to the share-
holders of consolidated subsidiaries.
Equity in earnings of affiliated companies during
fiscal 2014 increased by ¥86.8 billion, or 37.5%, to
¥318.3 billion compared with the prior fiscal year.
This increase was due mainly to an increase during
fiscal 2014 in net income attributable to the share-
holders of affiliated companies accounted for by the
equity method.
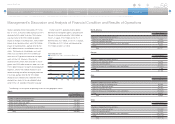
Net income attributable to the shareholders of
Toyota Motor Corporation increased by ¥860.9 bil-
lion, or 89.5%, to ¥1,823.1 billion during fiscal 2014
compared with the prior fiscal year.
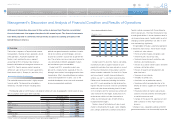
Net Income Attributable to
Toyota Motor Corporation and ROE
Net income attributable to Toyota Motor Corporation
ROE (Right scale)
(¥ Billion)
FY
(%)
2,000
0
20
1,500 15
1,000 10
500 5
0
’10 ’11 ’12 ’13 ’14
Management’s Discussion and Analysis of Financial Condition and Results of Operations
Selected Financial Summary (U.S. GAAP) Consolidated Segment Information Consolidated Quarterly Financial Summary Management’s Discussion and Analysis of Financial Condition and Results of Operations [10 of 14] Consolidated Financial Statements
Other Income and Expenses
Income Taxes
Net Income Attributable to Noncontrolling
Interests and Equity in Earnings of
Affiliated Companies
Other Comprehensive Income and Loss
Net Income Attributable to Toyota Motor
Corporation
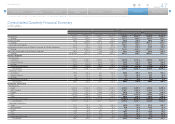
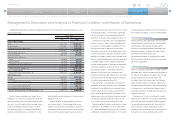
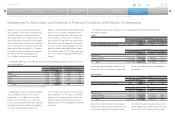
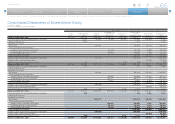
The following is a discussion of the results of operations for each of Toyota’s operating segments. The
amounts presented are prior to intersegment elimination.
Yen in millions
Years ended March 31, 2014 vs. 2013 Change
2013 2014 Amount Percentage (%)
Automotive: Net revenues 20,419,100 23,781,404 3,362,304 +16.5
Operating income 944,704 1,938,778 994,074 +105.2
Financial Services: Net revenues 1,170,670 1,421,047 250,377 +21.4
Operating income 315,820 294,891 (20,929) –6.6
All Other: Net revenues 1,066,461 1,151,280 84,819 +8.0
Operating income 53,616 64,270 10,654 +19.9
Intersegment elimination/
unallocated amount:
Net revenues (592,039) (661,820) (69,781) —
Operating income 6,748 (5,827) (12,575) —
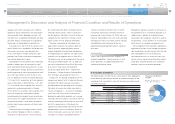
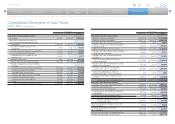
Automotive Operations Segment
The automotive operations segment is Toyota’s
largest operating segment by net revenues. Net rev-
enues for the automotive segment increased during
fiscal 2014 by ¥3,362.3 billion, or 16.5%, to
¥23,781.4 billion compared with the prior fiscal year.
The increase mainly reflects the ¥2,304.9 billion
favorable impact of fluctuations in foreign currency
translation rates and the ¥300.0 billion favorable
impact of changes in vehicle unit sales and
sales mix.
Operating income from the automotive operations
increased by ¥994.0 billion, or 105.2%, to ¥1,938.7
billion during fiscal 2014 compared with the prior
Segment Information