Toyota 2014 Annual Report Download - page 46
Download and view the complete annual report
Please find page 46 of the 2014 Toyota annual report below. You can navigate through the pages in the report by either clicking on the pages listed below, or by using the keyword search tool below to find specific information within the annual report.-
 1
1 -
2
-
3
-
4
-
5
-
6
-
7
-
8
-
9
-
10
-
11
-
12
-
13
-
14
-
15
-
16
-
17
-
18
-
19
-
20
-
21
-
22
-
23
-
24
-
25
-
26
-
27
-
28
-
29
-
30
-
31
-
32
-
33
-
34
-
35
-
 36
36 -
 37
37 -
 38
38 -
 39
39 -
 40
40 -
 41
41 -
 42
42 -
 43
43 -
 44
44 -
 45
45 -
 46
46 -
 47
47 -
 48
48 -
 49
49 -
 50
50 -
 51
51 -
 52
52 -
 53
53 -
 54
54 -
 55
55 -
 56
56 -
57
-
58
-
59
-
60
-
61
-
62
-
63
-
64
-
65
-
66
-
67
-
68
 |
 |
ANNUAL REPORT 2014
President’s MessagePresident’s Message
Overview of
Four Business Units
Overview of
Four Business Units
Special FeatureSpecial Feature
Review of OperationsReview of Operations
Consolidated Performance
Highlights
Consolidated Performance
Highlights
Management and
Corporate Information
Management and
Corporate Information
Investor InformationInvestor Information
Financial SectionFinancial Section
Page 46
NextPrev
ContentsSearchPrint
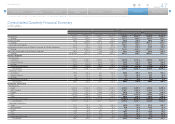
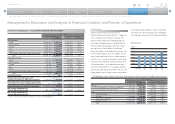
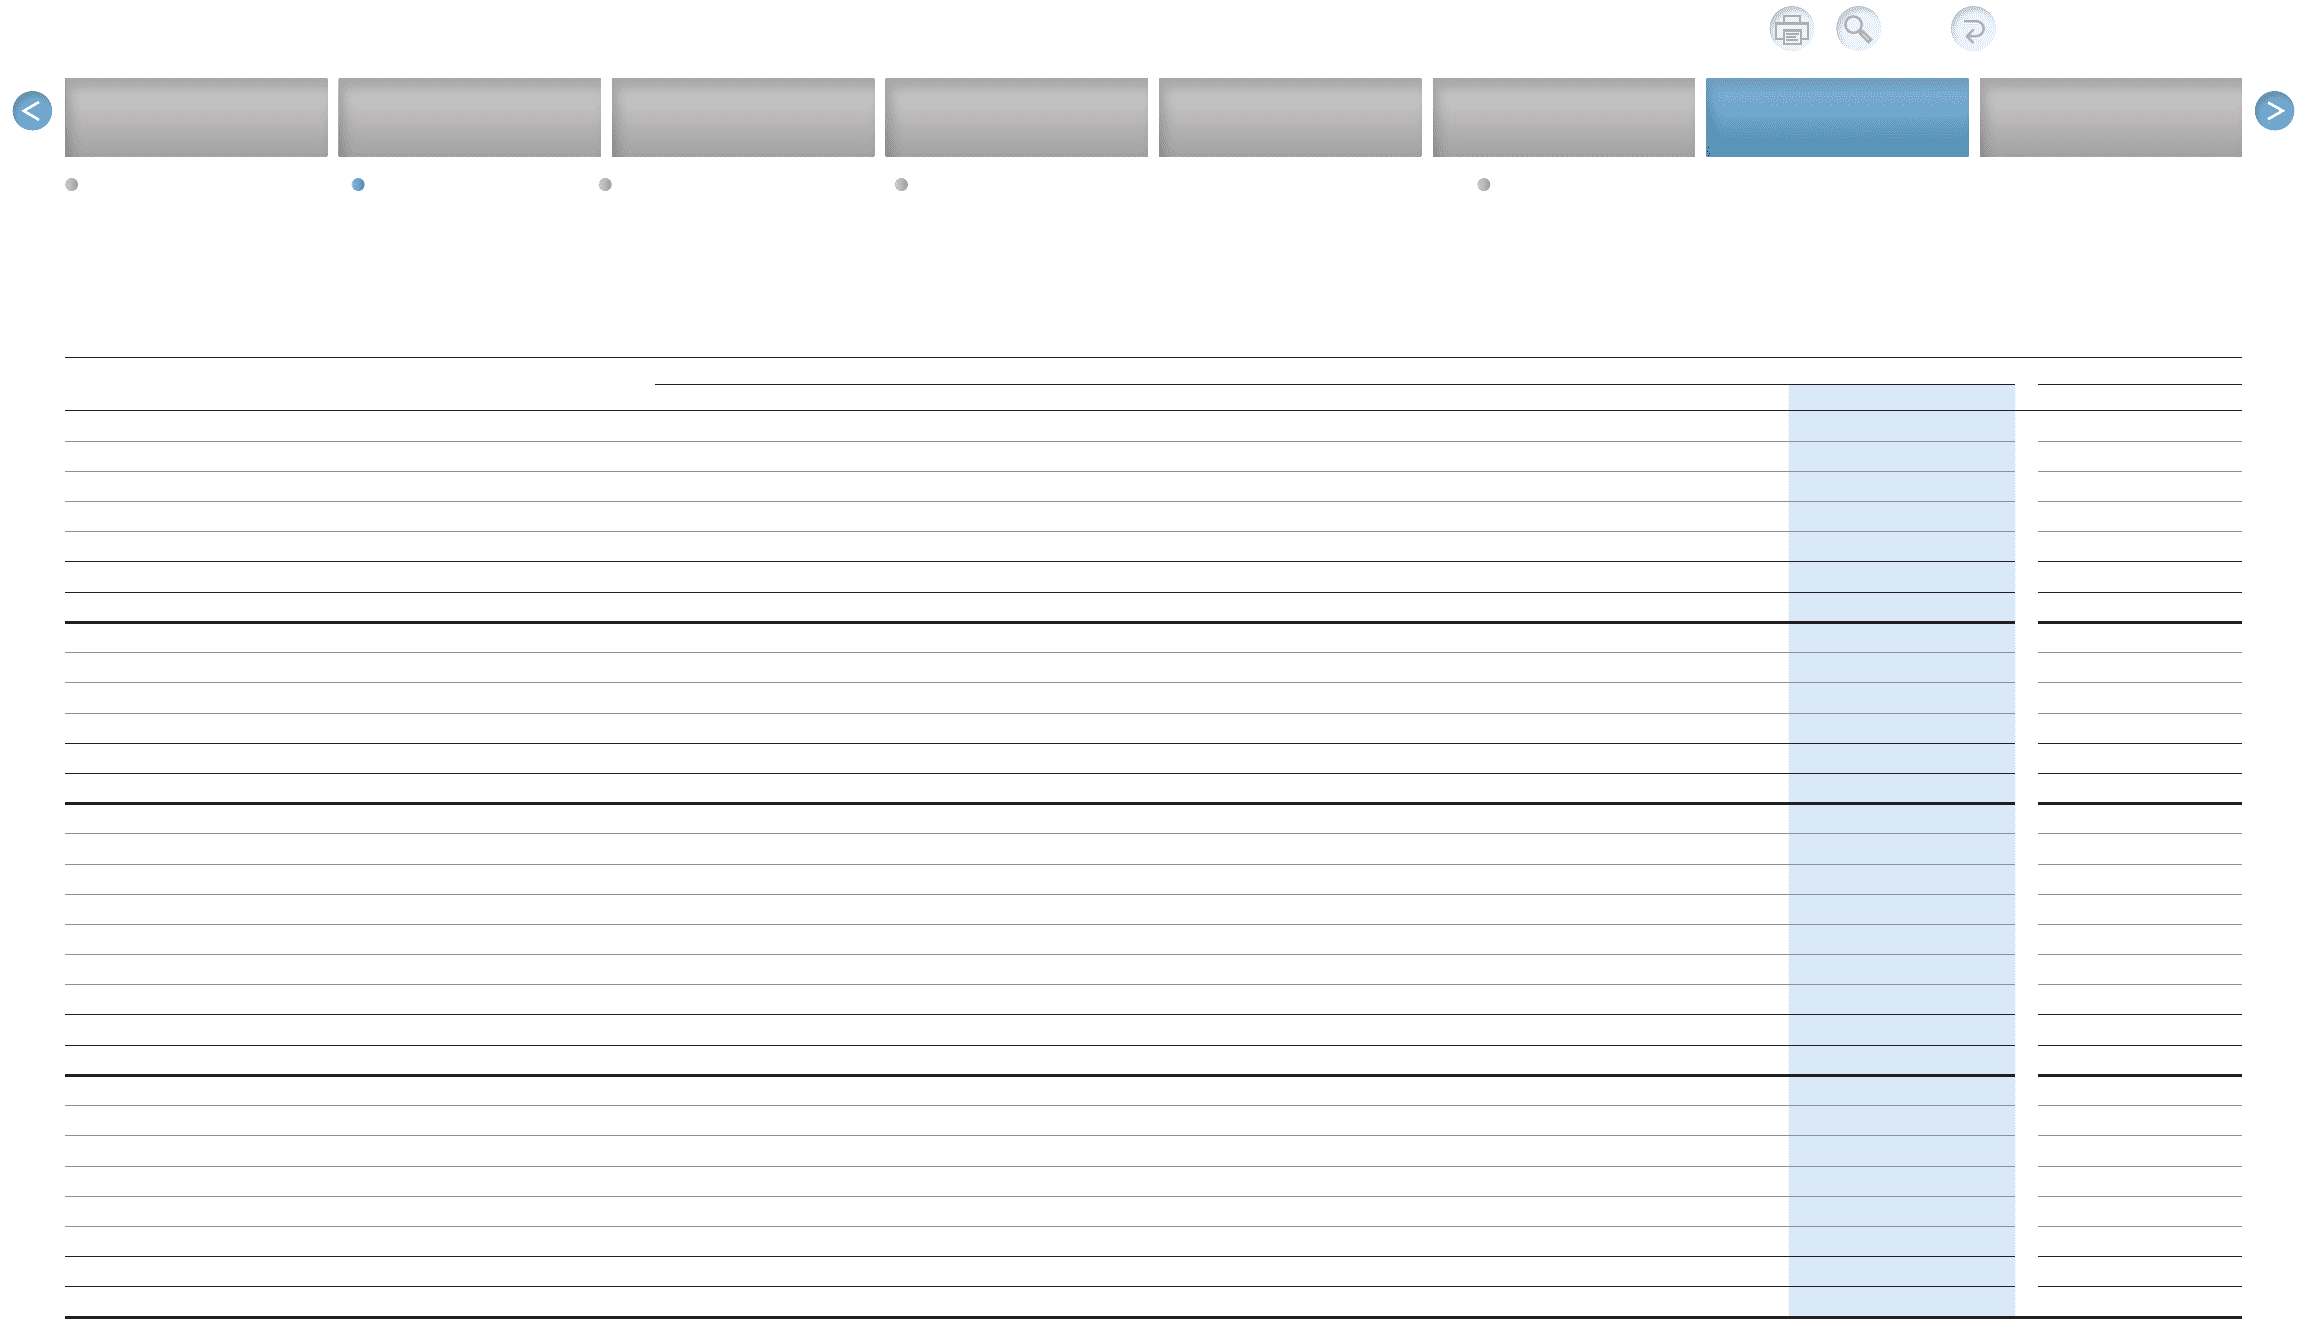
Consolidated Segment Information
Toyota Motor Corporation
Fiscal years ended March 31
Yen in millions % change
2009 2010 2011 2012 2013 2014 2014 vs. 2013
Business Segment:
Net Revenues:
Automotive 18,564,723 17,197,428 17,337,320 16,994,546 20,419,100 23,781,404 +16.5
Financial Services 1,377,548 1,245,407 1,192,205 1,100,324 1,170,670 1,421,047 +21.4
All Other 1,184,947 947,615 972,252 1,048,915 1,066,461 1,151,280 +8.0
Intersegment Elimination (597,648) (439,477) (508,089) (560,132) (592,039) (661,820) —
Consolidated 20,529,570 18,950,973 18,993,688 18,583,653 22,064,192 25,691,911 +16.4
Operating Income (Loss):
Automotive (394,876) (86,370) 85,973 21,683 944,704 1,938,778 +105.2
Financial Services (71,947) 246,927 358,280 306,438 315,820 294,891 –6.6
All Other 9,913 (8,860) 35,242 42,062 53,616 64,270 +19.9
Intersegment Elimination (4,101) (4,181) (11,216) (14,556) 6,748 (5,827) —
Consolidated (461,011) 147,516 468,279 355,627 1,320,888 2,292,112 +73.5
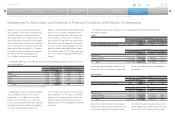
Geographic Information:
Net Revenues:
Japan 12,186,737 11,220,303 10,986,246 11,167,319 12,821,018 14,297,470 +11.5
North America 6,222,914 5,670,526 5,429,136 4,751,886 6,284,425 8,117,099 +29.2
Europe 3,013,128 2,147,049 1,981,497 1,993,946 2,083,113 2,724,959 +30.8
Asia 2,719,329 2,655,327 3,374,534 3,334,274 4,385,476 4,877,672 +11.2
Other 1,882,900 1,673,861 1,809,116 1,760,175 2,094,265 2,336,641 +11.6
Intersegment Elimination (5,495,438) (4,416,093) (4,586,841) (4,423,947) (5,604,105) (6,661,930) —
Consolidated 20,529,570 18,950,973 18,993,688 18,583,653 22,064,192 25,691,911 +16.4
Operating Income (Loss):
Japan (237,531) (225,242) (362,396) (207,040) 576,335 1,510,165 +162.0
North America (390,192) 85,490 339,503 186,409 221,925 326,052 +46.9
Europe (143,233) (32,955) 13,148 17,796 26,462 58,228 +120.0
Asia 176,060 203,527 312,977 256,790 376,055 395,737 +5.2
Other 87,648 115,574 160,129 108,814 133,744 42,568 –68.2
Intersegment Elimination 46,237 1,122 4,918 (7,142) (13,633) (40,638) —
Consolidated (461,011) 147,516 468,279 355,627 1,320,888 2,292,112 +73.5
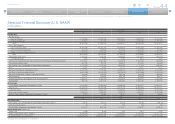
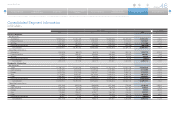
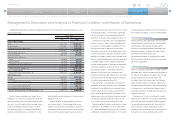
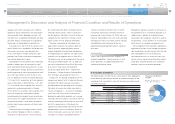
Selected Financial Summary (U.S. GAAP) Consolidated Segment Information Consolidated Quarterly Financial Summary Management’s Discussion and Analysis of Financial Condition and Results of Operations Consolidated Financial Statements