Toyota 2014 Annual Report Download - page 45
Download and view the complete annual report
Please find page 45 of the 2014 Toyota annual report below. You can navigate through the pages in the report by either clicking on the pages listed below, or by using the keyword search tool below to find specific information within the annual report.-
 1
1 -
2
-
3
-
4
-
5
-
6
-
7
-
8
-
9
-
10
-
11
-
12
-
13
-
14
-
15
-
16
-
17
-
18
-
19
-
20
-
21
-
22
-
23
-
24
-
25
-
26
-
27
-
28
-
29
-
30
-
31
-
32
-
33
-
34
-
 35
35 -
 36
36 -
 37
37 -
 38
38 -
 39
39 -
 40
40 -
 41
41 -
 42
42 -
 43
43 -
 44
44 -
 45
45 -
 46
46 -
 47
47 -
 48
48 -
 49
49 -
 50
50 -
 51
51 -
 52
52 -
 53
53 -
 54
54 -
 55
55 -
56
-
57
-
58
-
59
-
60
-
61
-
62
-
63
-
64
-
65
-
66
-
67
-
68
 |
 |
ANNUAL REPORT 2014
President’s MessagePresident’s Message
Overview of
Four Business Units
Overview of
Four Business Units
Special FeatureSpecial Feature
Review of OperationsReview of Operations
Consolidated Performance
Highlights
Consolidated Performance
Highlights
Management and
Corporate Information
Management and
Corporate Information
Investor InformationInvestor Information
Financial SectionFinancial Section
Page 45
NextPrev
ContentsSearchPrint
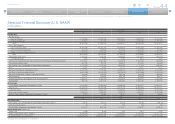
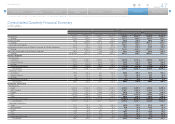
Yen in millions % change
2010 2011 2012 2013 2014 2014 vs. 2013
For the Year:
Net Revenues:
Sales of Products 17,724,729 17,820,520 17,511,916 20,914,150 24,312,644 +16.2
Financing Operations 1,226,244 1,173,168 1,071,737 1,150,042 1,379,267 +19.9
Total 18,950,973 18,993,688 18,583,653 22,064,192 25,691,911 +16.4
Costs and Expenses:
Cost of Products Sold 15,971,496 15,985,783 15,795,918 18,010,569 19,988,245 +11.0
Cost of Financing Operations 712,301 629,543 592,646 630,426 812,894 +28.9
Selling, General and Administrative 2,119,660 1,910,083 1,839,462 2,102,309 2,598,660 +23.6
Total 18,803,457 18,525,409 18,228,026 20,743,304 23,399,799 +12.8
Operating Income (Loss) 147,516 468,279 355,627 1,320,888 2,292,112 +73.5
% of Net Revenues 0.8% 2.5% 1.9% 6.0% 8.9% —
Income (Loss) before Income Taxes and Equity in Earnings of Affiliated Companies 291,468 563,290 432,873 1,403,649 2,441,080 +73.9
Provision for Income Taxes 92,664 312,821 262,272 551,686 767,808 +39.2
Net Income (Loss) Attributable to Toyota Motor Corporation 209,456 408,183 283,559 962,163 1,823,119 +89.5
ROE 2.1% 3.9% 2.7% 8.5% 13.7% —
Net Cash Provided by Operating Activities 2,558,530 2,024,009 1,452,435 2,451,316 3,646,035 +48.7
Net Cash Used in Investing Activities (2,850,184) (2,116,344) (1,442,658) (3,027,312) (4,336,248) —
Net Cash Provided by (Used in) Financing Activities (277,982) 434,327 (355,347) 477,242 919,480 +92.7
R&D Expenses 725,345 730,340 779,806 807,454 910,517 +12.8
Capital Expenditures for Property, Plant and Equipment* 604,536 629,326 723,537 854,561 970,021 +13.5
Depreciation 1,414,569 1,175,573 1,067,830 1,105,109 1,250,853 +13.2
At Year-End:
Toyota Motor Corporation Shareholders’ Equity 10,359,723 10,332,371 10,550,261 12,148,035 14,469,148 +19.1
Total Assets 30,349,287 29,818,166 30,650,965 35,483,317 41,437,473 +16.8
Long-Term Debt 7,015,409 6,449,220 6,042,277 7,337,824 8,546,910 +16.5
Cash and Cash Equivalents 1,865,746 2,080,709 1,679,200 1,718,297 2,041,170 +18.8
Ratio of Toyota Motor Corporation Shareholders’ Equity 34.1% 34.7% 34.4% 34.2% 34.9% —
Yen % change
2010 2011 2012 2013 2014 2014 vs. 2013
Per Share Data:
Net Income (Loss) Attributable to Toyota Motor Corporation (Basic) 66.79 130.17 90.21 303.82 575.30 +89.4
Annual Cash Dividends 45 50 50 90 165 +83.3
Toyota Motor Corporation Shareholders’ Equity 3,303.49 3,295.08 3,331.51 3,835.30 4,564.74 +19.0
Stock Information (March 31):
Stock Price 3,745 3,350 3,570 4,860 5,826 +19.9
Market Capitalization (Yen in millions) 12,912,751 11,550,792 12,309,351 16,757,268 20,088,033 +19.9
Number of Shares Issued (shares) 3,447,997,492 3,447,997,492 3,447,997,492 3,447,997,492 3,447,997,492 —
* Excluding vehicles and equipment of operating leases
Selected Financial Summary (U.S. GAAP)
Toyota Motor Corporation
Fiscal years ended March 31
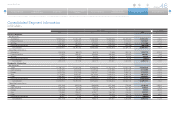
Selected Financial Summary (U.S. GAAP) [2 of 2] Consolidated Segment Information Consolidated Quarterly Financial Summary Management’s Discussion and Analysis of Financial Condition and Results of Operations Consolidated Financial Statements