Symantec 1997 Annual Report Download - page 55
Download and view the complete annual report
Please find page 55 of the 1997 Symantec annual report below. You can navigate through the pages in the report by either clicking on the pages listed below, or by using the keyword search tool below to find specific information within the annual report.
53
SYMANTEC CORPORATION
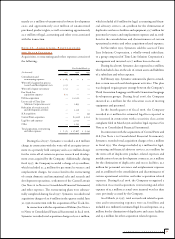
ing lawsuits vigorously and although adverse decisions (or
settlements) may occur in one or more of the cases, the final
resolution of these lawsuits, individually or in the aggregate,
is not expected to have a material adverse effect on the financial
position of the Company. However, depending on the
amount and timing of an unfavorable resolution of these
lawsuits, it is possible that the Company’s future results of
operations or cash flows could be materially adversely affected
in a particular period.
Note 12. Segment Information
Symantec operates in the microcomputer software industry
business segment. The Company markets its products in
North America and international countries primarily through
retail and distribution channels.
Information by Geographic Area
Year Ended March 31,
(In thousands) 1997 1996 1995
Net revenues:
U.S. operations:
North American customers $334,210 $ 303,280 $296,684
International customers 6,451 16,609 16,977
Intercompany 79 6,015 4,625
340,740 325,904 318,286
Other international operations:
Customers 131,522 125,543 117,607
Intercompany 745 11,387 13,865
132,267 136,930 131,472
Eliminations (824) (17,402) (18,490)
$ 472,183 $ 445,432 $ 431,268
Operating income (loss):
U.S. operations $11,415 $ (58,296) $ 17,907
International operations 12,931 8,201 23,449
Eliminations 1,943 1,816 (1,070)
$ 26,289 $ (48,279) $ 40,286
March 31,
(In thousands) 1997 1996 1995
Identifiable assets:
U.S. operations $284,023 $ 236,508 $ 255,748
International operations 57,650 48,519 50,378
$ 341,673 $ 285,027 $ 306,126
Intercompany sales between geographic areas are
accounted for at prices representative of unaffiliated party
transactions. “U.S. operations” include sales to customers in
the United States and exports of finished goods directly to
international customers, primarily in Canada. Exports and
international OEM transactions are primarily denominated
in U.S. dollars. “Other international operations” primarily
include export sales from the Irish manufacturing subsidiary
to European and Asia/Pacific customers. International
revenues, which include net revenues from other interna-
tional operations and exports made by U.S. operations, were
29%, 32% and 31% of total revenue for fiscal 1997, 1996 and
1995, respectively.
Significant Customers
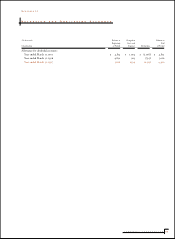
The following customers accounted for more than 10% of net
revenues during fiscal 1997, 1996 and 1995:
Year Ended March 31,
1997 1996 1995
Ingram Micro, Inc. 27% 27% 22%
Merisel Americas, Inc. *10 11
* Amount is less than 10%.


