Suzuki 2008 Annual Report Download - page 6
Download and view the complete annual report
Please find page 6 of the 2008 Suzuki annual report below. You can navigate through the pages in the report by either clicking on the pages listed below, or by using the keyword search tool below to find specific information within the annual report.-
 1
1 -
 2
2 -
 3
3 -
 4
4 -
 5
5 -
 6
6 -
 7
7 -
 8
8 -
 9
9 -
 10
10 -
 11
11 -
 12
12 -
 13
13 -
 14
14 -
 15
15 -
 16
16 -
 17
17 -
18
-
19
-
20
-
21
-
22
-
23
-
24
-
25
-
26
-
27
-
28
-
29
-
30
-
31
-
32
-
33
-
34
-
35
-
36
-
37
-
38
-
39
-
40
-
41
-
42
-
43
-
44
-
45
-
46
-
47
-
48
-
49
-
50
-
51
-
52
 |
 |

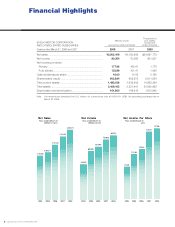
SUZUKI MOTOR CORPORATION 5
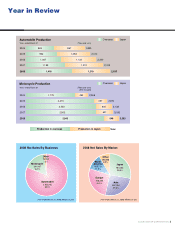
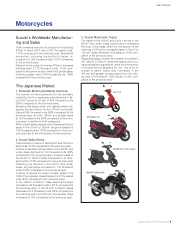
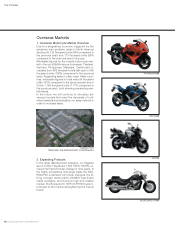
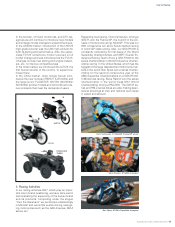
Year in Review
Automobile
2,833,892
80.9%
2008 Net Sales By Business 2008 Net Sales By Market
(Year ended March 31, 2008, Millions of yen) (Year ended March 31, 2008, Millions of yen)
Japan
981,383
28.0%
Other
296,958
8.5%
North
America
415,713
11.9%
Europe
920,459
26.3%
Asia
887,904
25.3%
Other
76,559
2.2%
Motorcycle
591,967
16.9%
Automobile Production
Years ended March 31 (Thousand units)
2004 863
952
1,067
1,199
1,418
967
1,058
1,133
1,212
1,219
2005
2006
2007
2008
1,830
2,010
2,200
2,412
2,637
Overseas Japan
Motorcycle Production
Years ended March 31 (Thousand units)
(ATV included)
2004 1,775
2,473
2,533
2,562
2,843
493
497
605
621
549
2005
2006
2007
2008
2,268
2,970
3,138
3,183
3,393
Overseas Japan
Total
Production in overseas Production in Japan