Suzuki 2008 Annual Report Download - page 28
Download and view the complete annual report
Please find page 28 of the 2008 Suzuki annual report below. You can navigate through the pages in the report by either clicking on the pages listed below, or by using the keyword search tool below to find specific information within the annual report.-
 1
1 -
2
-
3
-
4
-
5
-
6
-
7
-
8
-
9
-
10
-
11
-
12
-
13
-
14
-
15
-
16
-
17
-
 18
18 -
 19
19 -
 20
20 -
 21
21 -
 22
22 -
 23
23 -
 24
24 -
 25
25 -
 26
26 -
 27
27 -
 28
28 -
 29
29 -
 30
30 -
 31
31 -
 32
32 -
 33
33 -
 34
34 -
 35
35 -
 36
36 -
 37
37 -
 38
38 -
39
-
40
-
41
-
42
-
43
-
44
-
45
-
46
-
47
-
48
-
49
-
50
-
51
-
52
 |
 |

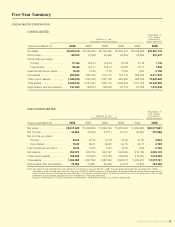
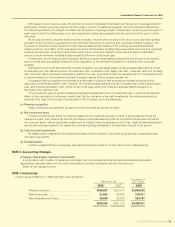
SUZUKI MOTOR CORPORATION 27
Years ended March 31 2008 2007 2006 2005 2004 2008
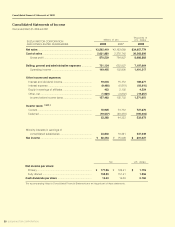
Net sales .................................. ¥3,502,419 ¥3,163,669 ¥2,746,453 ¥2,365,571 ¥2,198,986 $34,957,779
Net income ............................... 80,254 75,008 65,945 60,506 43,835 801,027
Net income per share:
Primary ................................. 177.96 169.41 125.64 112.94 81.38 1.776
Fully diluted .......................... 155.89 151.41 122.14 109.86 79.17 1.556
Cash dividends per share........ 16.00 14.00 11.00 10.00 9.00 0.160
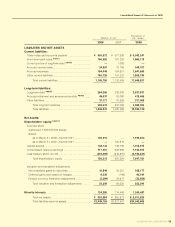
Net Assets ................................ 902,894 855,973 616,770 745,016 692,345 9,011,824
Total current assets.................. 1,483,038 1,435,405 1,067,709 999,887 902,263 14,802,264
Total assets .............................. 2,409,165 2,321,441 1,849,714 1,693,353 1,577,709 24,045,963
Depreciation and amortization . 161,600 149,910 126,520 97,731 87,858 1,612,945
SUZUKI MOTOR CORPORATION
CONSOLIDATED
NON-CONSOLIDATED
Thousands of
U.S. dollars
(except per
share amounts)
Years ended March 31 2008 2007 2006 2005 2004 2008
Net sales .................................. ¥2,031,639 ¥1,939,806 ¥1,690,169 ¥1,481,632 ¥1,392,688 $20,277,867
Net income ............................... 40,864 43,054 37,271 35,747 25,650 407,869
Net income per share:
Primary ................................. 90.60 97.23 70.78 66.56 47.46 0.904
Fully diluted .......................... 79.39 86.91 68.82 64.75 46.17 0.792
Cash dividends per share........ 16.00 14.00 11.00 10.00 9.00 0.160
Net Assets ................................ 453,374 429,730 364,127 540,890 518,198 4,525,142
Total current assets.................. 758,848 758,005 518,728 589,848 519,025 7,574,092
Total assets .............................. 1,430,088 1,381,889 1,082,344 1,098,073 1,039,261 14,273,761
Depreciation and amortization . 76,584 73,881 59,362 47,213 47,836 764,390
Note: Yen amounts are translated into U.S. dollars for convenience only, at ¥100.19 = US$1, the prevailing exchange rate as of March 31, 2008.
Calculation of net income per share from the year of 2004 to 2006 is made on the adjusted net income basis excluding the bonuses paid to
directors and corporate auditors and the payment of dividends to shareholders of preferred stocks from net income shown in the income
statements in accordance with the revision of regulations of financial statements.
Figures in “Net assets” of FY2006 and before are referred to “Shareholder’s equity” in previous, respectively.
Millions of yen
(except per share amounts)
Thousands of
U.S. dollars
(except per
share amounts)
Millions of yen
(except per share amounts)
Five-Year Summary