Suzuki 2008 Annual Report Download - page 33
Download and view the complete annual report
Please find page 33 of the 2008 Suzuki annual report below. You can navigate through the pages in the report by either clicking on the pages listed below, or by using the keyword search tool below to find specific information within the annual report.-
 1
1 -
2
-
3
-
4
-
5
-
6
-
7
-
8
-
9
-
10
-
11
-
12
-
13
-
14
-
15
-
16
-
17
-
18
-
19
-
20
-
21
-
22
-
 23
23 -
 24
24 -
 25
25 -
 26
26 -
 27
27 -
 28
28 -
 29
29 -
 30
30 -
 31
31 -
 32
32 -
 33
33 -
 34
34 -
 35
35 -
 36
36 -
 37
37 -
 38
38 -
 39
39 -
 40
40 -
 41
41 -
 42
42 -
 43
43 -
44
-
45
-
46
-
47
-
48
-
49
-
50
-
51
-
52
 |
 |

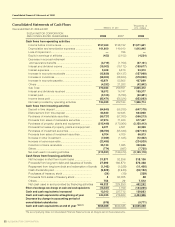
32 SUZUKI MOTOR CORPORATION
Consolidated Statements of Cash Flows
Years ended March 31, 2008 and 2007
Cash flows from operating activities
Income before income taxes ......................................... ¥157,463 ¥138,732 $1,571,651
Depreciation and amortization expenses ...................... 161,600 149,910 1,612,945
Loss of impairment ......................................................... —796 —
Equity in earnings of affiliates ........................................ (453) (2,102) (4,524)
Decrease in accrued retirement
and severance benefits ................................................ (3,719) (1,750) (37,121)
Interest and dividend income ........................................ (19,003) (15,172) (189,677)
Interest expenses........................................................... 9,408 6,810 93,910
Increase in accounts receivable .................................... (15,829) (64,137) (157,998)
Increase in inventories ................................................... (58,003) (28,623) (578,930)
Increase in accounts payable ........................................ 42,871 53,805 427,899
Others ............................................................................ (4,292) 21,283 (42,842)
Sub Total 270,043 259,551 2,695,312
Interest and dividends received .................................... 18,572 14,747 185,377
Interest paid ................................................................... (9,105) (5,780) (90,881)
Income taxes paid ......................................................... (85,471) (66,324) (853,093)
Net cash provided by operating activities 194,039 202,194 1,936,714
Cash flows from investing activities
Deposit in time deposit ................................................... (64,840) (56,335) (647,178)
Disbursement from time deposit .................................... 63,620 62,635 634,998
Purchases of marketable securities ............................... (55,727) (57,383) (556,213)
Proceeds from sales of marketable securities ............... 67,874 71,940 677,457
Purchases of property, plants and equipment ............... (215,449) (173,064) (2,150,413)
Proceeds from sales of property, plants and equipment . 6,071 4,561 60,599
Purchases of investment securities ................................ (28,764) (55,330) (287,103)
Proceeds from sales of investment securities ................ 6,704 4,760 66,913
Increase in other investment .......................................... (7,269) (1,345) (72,552)
Increase in loans receivable........................................... (22,495) —(224,529)
Collection of loans receivable ........................................ 35,130 1,085 350,636
Others ............................................................................. (774) (997) (7,730)
Net cash used in investing activities (215,921) (199,473) (2,155,118)
Cash flows from financing activities
Net increase in short term bank loans ...................... 31,871 32,296 318,106
Proceeds from long term debt and issuance of bonds 27,090 166,870 270,388
Repayment from long term debt and redemption of bonds (1,142) (1,028) (11,400)
Cash dividends paid ................................................. (9,229) (6,943) (92,122)
Purchases of treasury stock ...................................... (24) (19) (239)
Proceeds from sales of treasury stock ...................... 432,085 48
Others ........................................................................ 752 29 7,512
Net cash used in and provided by financing activities 49,322 223,290 492,292
Effect of exchange rate change on cash and cash equivalents
(14,427) 1,700 (144,005)
Cash and cash equivalents increased 13,013 227,712 129,883
Cash and cash equivalents at beginning of year 444,335 216,623 4,434,926
Decrease by change in accounting period of
consolidated subsidiaries (978) —(9,771)
Cash and cash equivalents at end of year *NOTE 11 ¥456,369 ¥444,335 $4,555,038
The accompanying Notes to Consolidated Financial Statements are an integral part of these statements.
Thousands of
U.S. dollars
SUZUKI MOTOR CORPORATION
AND CONSOLIDATED SUBSIDIARIES 2008 2007 2008
Millions of yen
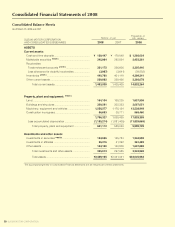
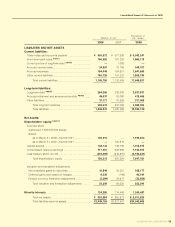
Consolidated Financial Statements of 2008