Suzuki 2008 Annual Report Download - page 37
Download and view the complete annual report
Please find page 37 of the 2008 Suzuki annual report below. You can navigate through the pages in the report by either clicking on the pages listed below, or by using the keyword search tool below to find specific information within the annual report.-
 1
1 -
2
-
3
-
4
-
5
-
6
-
7
-
8
-
9
-
10
-
11
-
12
-
13
-
14
-
15
-
16
-
17
-
18
-
19
-
20
-
21
-
22
-
23
-
24
-
25
-
26
-
 27
27 -
 28
28 -
 29
29 -
 30
30 -
 31
31 -
 32
32 -
 33
33 -
 34
34 -
 35
35 -
 36
36 -
 37
37 -
 38
38 -
 39
39 -
 40
40 -
 41
41 -
 42
42 -
 43
43 -
 44
44 -
 45
45 -
 46
46 -
 47
47 -
48
-
49
-
50
-
51
-
52
 |
 |

36 SUZUKI MOTOR CORPORATION
Millions of yen
Millions of yen
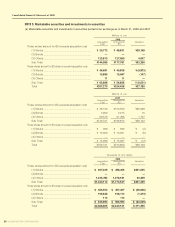
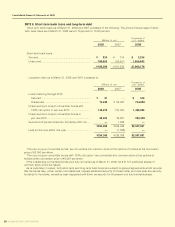
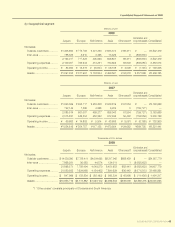
NOTE 5: Marketable securities and investments in securities
(a) Marketable securities and investments in securities quoted at an exchange as of March 31, 2008 and 2007
Those whose amount for BS exceeds acquisition cost
(1) Stocks .................................................................. ¥ 20,772 ¥ 49,931 ¥29,158
(2) Bonds ................................................................... —— —
(3) Others .................................................................. 123,813 127,860 4,047
Sub Total ¥144,585 ¥177,791 ¥33,206
Those whose amount for BS does not exceed acquisition cost
(1) Stocks ................................................................. ¥ 46,681 ¥ 40,808 ¥ (5,873)
(2) Bonds .................................................................. 15,995 15,847 (147)
(3) Others ................................................................. 11 11 —
Sub Total ¥ 62,688 ¥ 56,666 ¥ (6,021)
Total ¥207,273 ¥234,458 ¥27,185
Acquisition
Cost Amounts for
BS
Valuation
Those whose amount for BS exceeds acquisition cost
(1) Stocks ................................................................. ¥ 48,160 ¥104,559 ¥56,399
(2) Bonds .................................................................. 3,000 3,015 15
(3) Others ................................................................. 89,570 91,298 1,727
Sub Total ¥140,731 ¥198,873 ¥58,142
Those whose amount for BS does not exceed acquisition cost
(1) Stocks ................................................................. ¥ 999 ¥ 996 ¥
(3)
(2) Bonds .................................................................. ¥ 15,000 ¥ 14,991 ¥
(8)
(3) Others ................................................................. — — —
Sub Total ¥ 15,999 ¥ 15,987 ¥
(12)
Total ¥156,731 ¥214,860 ¥58,129
Acquisition
Cost
Amounts for
BS
Valuation
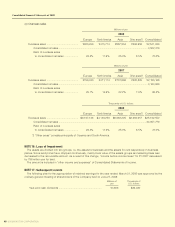
Thousands of U.S. dollars
Those whose amount for BS exceeds acquisition cost
(1) Stocks ................................................................. $ 207,329 $ 498,365 $291,035
(2) Bonds .................................................................. —— —
(3) Others ................................................................. 1,235,782 1,276,181 40,399
Sub Total $1,443,112 $1,774,547 $331,435
Those whose amount for BS does not exceed acquisition cost
(1) Stocks ................................................................. $ 465,933 $ 407,307 $ (58,626)
(2) Bonds .................................................................. 159,646 158,173 (1,473)
(3) Others ................................................................. 113 113 —
Sub Total $ 625,693 $ 565,593 $ (60,099)
Total $2,068,805 $2,340,141 $ 271,335
Acquisition
Cost Amounts for
BS
Valuation
2008
2007
2008
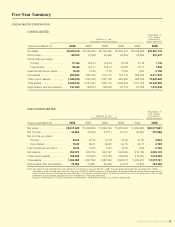
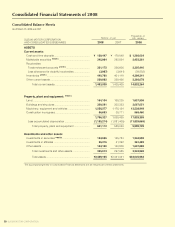
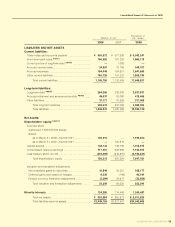
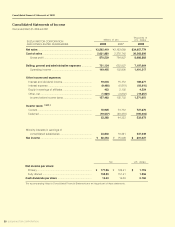
Consolidated Financial Statements of 2008