Suzuki 2008 Annual Report Download - page 46
Download and view the complete annual report
Please find page 46 of the 2008 Suzuki annual report below. You can navigate through the pages in the report by either clicking on the pages listed below, or by using the keyword search tool below to find specific information within the annual report.-
 1
1 -
2
-
3
-
4
-
5
-
6
-
7
-
8
-
9
-
10
-
11
-
12
-
13
-
14
-
15
-
16
-
17
-
18
-
19
-
20
-
21
-
22
-
23
-
24
-
25
-
26
-
27
-
28
-
29
-
30
-
31
-
32
-
33
-
34
-
35
-
 36
36 -
 37
37 -
 38
38 -
 39
39 -
 40
40 -
 41
41 -
 42
42 -
 43
43 -
 44
44 -
 45
45 -
 46
46 -
 47
47 -
 48
48 -
 49
49 -
 50
50 -
 51
51 -
 52
52
 |
 |

SUZUKI MOTOR CORPORATION 45
Millions of yen
2008
Elimination and
Japan Europe
North America
Asia
Other areas*1
corporate assets
Consolidated
Net sales:
Outside customers ...........
¥1,405,694 ¥ 773,708 ¥ 401,230 ¥ 833,374 ¥ 88,411 ¥ — ¥3,502,419
Inter-area ..........................
788,323 3,615 4,465 13,426 0 (809,830) —
2,194,017 777,323 405,696 846,801 88,411 (809,830) 3,502,419
Operating expenses .........
2,109,057 763,944 414,231 790,662 83,803 (808,685) 3,353,014
Operating income .............
¥ 84,960 ¥ 13,378 ¥ (8,535) ¥ 56,138 ¥ 4,608 ¥ (1,145) ¥ 149,405
Assets ...............................
¥1,097,453 ¥ 317,991 ¥ 102,504 ¥ 499,597 ¥ 34,018 ¥ 357,599 ¥2,409,165
Net sales:
Outside customers ...........
¥1,343,369 ¥ 653,717 ¥ 455,208 ¥ 649,819 ¥ 61,554 ¥ — ¥3,163,669
Inter-area ..........................
742,144 7,290 4,068 6,224 0 (759,727) —
2,085,514 661,007 459,277 656,043 61,554 (759,727) 3,163,669
Operating expenses .........
2,015,831 646,204 453,362 612,436 56,492 (753,559) 3,030,769
Operating income .............
¥ 69,683 ¥ 14,803 ¥ 5,914 ¥ 43,606 ¥ 5,061 ¥ (6,168) ¥ 132,900
Assets ...............................
¥1,034,616 ¥ 304,757 ¥117,135 ¥ 470,564 ¥ 24,662 ¥369,705 ¥2,321,441
Net sales:
Outside customers ...........
$ 14,030,290 $7,722,411 $4,004,695 $8,317,942 $882,439 $ — $34,957,779
Inter-area ..........................
7,868,281 36,083 44,574 134,011 1 (8,082,952) —
21,898,571 7,758,494 4,049,270 8,451,953 882,441 (8,082,952) 34,957,779
Operating expenses .........
21,050,582 7,624,960 4,134,462 7,891,629 836,442 (8,071,515) 33,466,561
Operating income .............
$ 847,989 $ 133,534 $ (85,192) $ 560,324 $ 45,998 $ (11,436) $ 1,491,217
Assets ...............................
$10,953,719 $3,173,882 $1,023,102 $4,986,504 $339,538 $3,569,215 $24,045,963
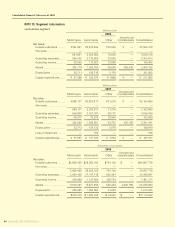
(b) Geographical segment
Thousands of U.S. dollars
2008
Elimination and
Japan Europe
North America
Asia
Other areas*1
corporate assets
Consolidated
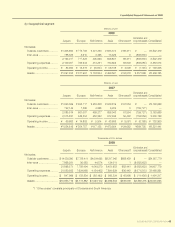
*1 “Other areas” consists principally of Oceania and South America.
Millions of yen
2007
Elimination and
Japan Europe
North America
Asia
Other areas*1
corporate assets
Consolidated
Consolidated Financial Statements of 2008