Suzuki 2008 Annual Report Download - page 45
Download and view the complete annual report
Please find page 45 of the 2008 Suzuki annual report below. You can navigate through the pages in the report by either clicking on the pages listed below, or by using the keyword search tool below to find specific information within the annual report.-
 1
1 -
2
-
3
-
4
-
5
-
6
-
7
-
8
-
9
-
10
-
11
-
12
-
13
-
14
-
15
-
16
-
17
-
18
-
19
-
20
-
21
-
22
-
23
-
24
-
25
-
26
-
27
-
28
-
29
-
30
-
31
-
32
-
33
-
34
-
 35
35 -
 36
36 -
 37
37 -
 38
38 -
 39
39 -
 40
40 -
 41
41 -
 42
42 -
 43
43 -
 44
44 -
 45
45 -
 46
46 -
 47
47 -
 48
48 -
 49
49 -
 50
50 -
 51
51 -
 52
52
 |
 |
44 SUZUKI MOTOR CORPORATION
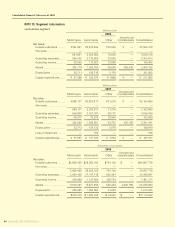
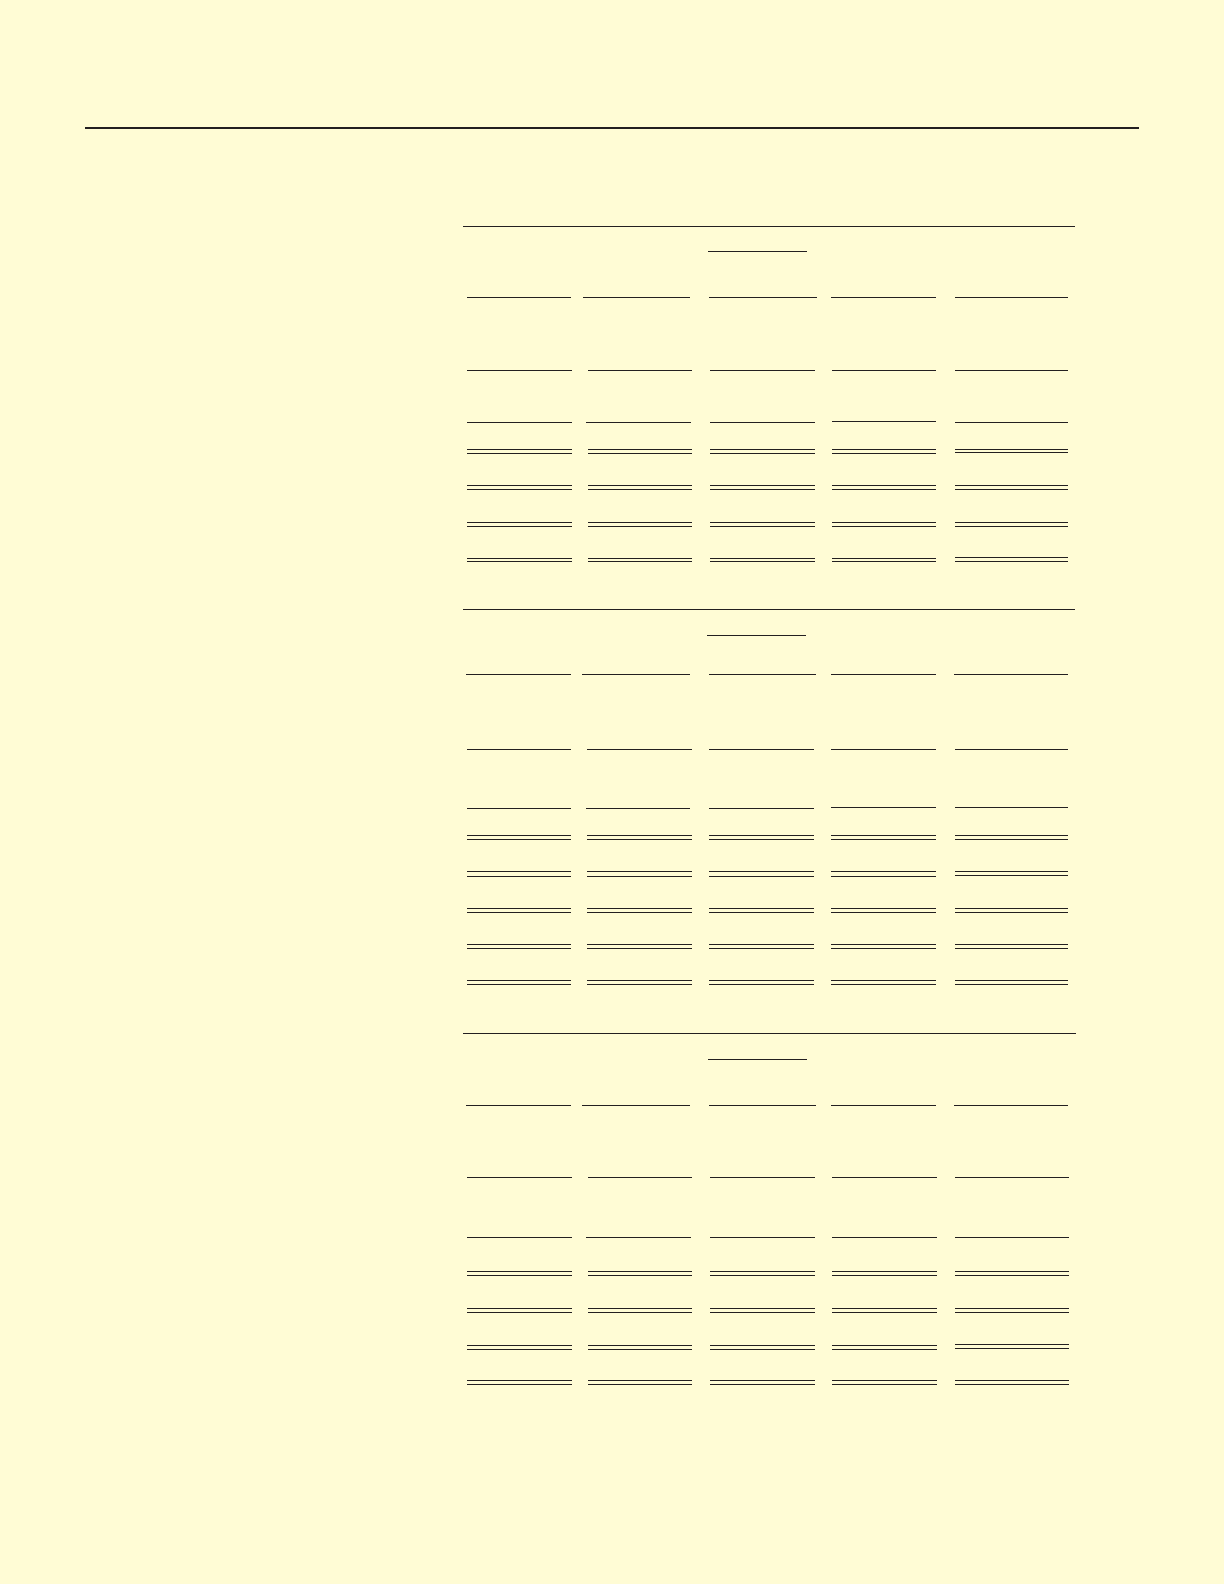
Millions of yen
2008
Elimination and
Motorcycle Automobile Other
corporate assets
Consolidated
Net sales:
Outside customers ......... ¥591,967 ¥2,833,892 ¥76,559 ¥ — ¥3,502,419
Inter-area ........................ — — — — —
591,967 2,833,892 76,559 — 3,502,419
Operating expenses ....... 569,425 2,719,929 63,659 — 3,353,014
Operating income ........... 22,542 113,962 12,899 — 149,405
Assets ............................. 351,710 1,595,764 55,640 406,048 2,409,165
Depreciation ................... 22,711 136,718 2,170 — 161,600
Capital expenditures ...... ¥ 27,099 ¥ 182,570 ¥ 1,996 ¥ — ¥ 211,665
Millions of yen
2007
Elimination and
Motorcycle Automobile Other
corporate assets
Consolidated
Net sales:
Outside customers ......... ¥588,177 ¥2,503,817 ¥71,674 ¥ — ¥3,163,669
Inter-area ........................ — — — — —
588,177 2,503,817 71,674 — 3,163,669
Operating expenses ....... 542,800 2,427,241 60,727 — 3,030,769
Operating income ........... 45,377 76,576 10,946 — 132,900
Assets ............................. 335,668 1,506,881 53,702 425,188 2,321,441
Depreciation ................... 23,713 124,125 2,070 — 149,910
Loss of impairment ......... — 796 — — 796
Capital expenditures ...... ¥ 27,957 ¥ 137,725 ¥ 1,994 ¥ — ¥ 167,677
Thousands of U.S. dollars
2008
Elimination and
Motorcycle Automobile Other
corporate assets
Consolidated
Net sales:
Outside customers ......... $5,908,450 $28,285,182 $764,146 $ — $34,957,779
Inter-area ........................ — — — — —
5,908,450 28,285,182 764,146 — 34,957,779
Operating expenses ....... 5,683,452 27,147,718 635,391 — 33,466,561
Operating income ........... 224,998 1,137,464 128,754 — 1,491,217
Assets ............................. 3,510,437 15,927,384 555,354 4,052,786 24,045,963
Depreciation ................... 226,685 1,364,595 21,663 — 1,612,945
Capital expenditures ...... $270,479 $ 1,822,238 $ 19,924 $ — $ 2,112,642
NOTE 15: Segment information
(a) Business segment
Consolidated Financial Statements of 2008