Suzuki 2008 Annual Report Download - page 5
Download and view the complete annual report
Please find page 5 of the 2008 Suzuki annual report below. You can navigate through the pages in the report by either clicking on the pages listed below, or by using the keyword search tool below to find specific information within the annual report.-
 1
1 -
 2
2 -
 3
3 -
 4
4 -
 5
5 -
 6
6 -
 7
7 -
 8
8 -
 9
9 -
 10
10 -
 11
11 -
 12
12 -
 13
13 -
 14
14 -
 15
15 -
 16
16 -
17
-
18
-
19
-
20
-
21
-
22
-
23
-
24
-
25
-
26
-
27
-
28
-
29
-
30
-
31
-
32
-
33
-
34
-
35
-
36
-
37
-
38
-
39
-
40
-
41
-
42
-
43
-
44
-
45
-
46
-
47
-
48
-
49
-
50
-
51
-
52
 |
 |

4 SUZUKI MOTOR CORPORATION
Years ended March 31
(Millions of yen)
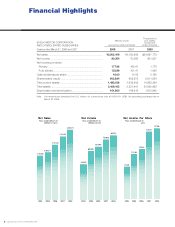
2,365,571
2,198,986
Net Sales
2004
2,746,453
2005
3,163,669
2006
3,502,419
Years ended March 31
(Millions of yen)
Net Income
2004 2005
65,945
2006
75,008
80,254
43,835
60,506
Years ended March 31
(yen)
Net Income Per Share
2004 2005
125.64
2006
2007 2008 2008 2008
2007 2007
169.41
177.96
81.38
112.94
Financial Highlights
Thousands of
Millions of yen U.S. dollars
(except per
(except per share amounts) share amounts)
Years ended March 31, 2008 and 2007
2008 2007 2008
Net sales ............................................................................ ¥3,502,419 ¥3,163,669 $1$34,957,779
Net income ......................................................................... 80,254 75,008 801,027
Net income per share:
Primary ............................................................................ 177.96 169.41 1.776
Fully diluted ..................................................................... 155.89 151.41 1.556
Cash dividends per share.................................................. 16.00 14.00 0.160
Shareholders’ equity .......................................................... 902,894 855,973 4,69,011,824
Total current assets............................................................ 1,483,038 1,435,405 14,802,264
Total assets ........................................................................ 2,409,165 2,321,441 24,045,963
Depreciation and amortization ........................................... 161,600 149,910 1,612,945
Note: Yen amounts are translated into U.S. dollars, for convenience only, at ¥100.19 = US$1, the prevailing exchange rate on
March 31, 2008.
SUZUKI MOTOR CORPORATION
AND CONSOLIDATED SUBSIDIARIES