Suzuki 2008 Annual Report Download - page 49
Download and view the complete annual report
Please find page 49 of the 2008 Suzuki annual report below. You can navigate through the pages in the report by either clicking on the pages listed below, or by using the keyword search tool below to find specific information within the annual report.-
 1
1 -
2
-
3
-
4
-
5
-
6
-
7
-
8
-
9
-
10
-
11
-
12
-
13
-
14
-
15
-
16
-
17
-
18
-
19
-
20
-
21
-
22
-
23
-
24
-
25
-
26
-
27
-
28
-
29
-
30
-
31
-
32
-
33
-
34
-
35
-
36
-
37
-
38
-
 39
39 -
 40
40 -
 41
41 -
 42
42 -
 43
43 -
 44
44 -
 45
45 -
 46
46 -
 47
47 -
 48
48 -
 49
49 -
 50
50 -
 51
51 -
 52
52
 |
 |

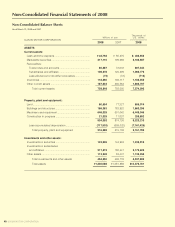
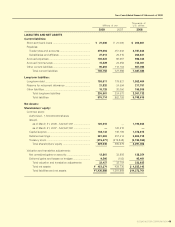
48 SUZUKI MOTOR CORPORATION
Thousands of
SUZUKI MOTOR CORPORATION
Millions of yen U.S. dollars
2008 2007 2008
ASSETS
Current assets:
Cash and time deposits.................................................. ¥ 48,758 ¥ 55,375 $ 486,658
Marketable securities ..................................................... 217,110 199,988 2,166,987
Receivables:
Trade notes and accounts .......................................... 80,887 72,632 807,344
Subsidiaries and affiliates ........................................... 106,278 120,399 1,060,772
Less allowance for doubtful receivables..................... (72) (72) (718)
Inventories ...................................................................... 118,850 109,117 1,186,250
Other current assets ....................................................... 187,034 200,563 1,866,797
Total current assets 758,848 758,005 7,574,092
Property, plant and equipment:
Land................................................................................ 80,654 77,327 805,014
Buildings and structures................................................. 186,383 183,922 1,860,296
Machinery and equipment.............................................. 646,029 601,042 6,448,046
Construction in progress ................................................ 21,025 11,837 209,852
934,092 874,130 9,323,210
Less accumulated depreciation.................................. (717,503) (659,022) (7,161,426)
Total property, plant and equipment 216,589 215,108 2,161,784
Investments and other assets:
Investments in securities ................................................ 123,926 144,903 1,236,912
Investments in subsidiaries
and affiliates ................................................................ 217,474 180,441 2,170,622
Other assets ................................................................... 113,249 83,431 1,130,350
Total investments and other assets 454,650 408,776 4,537,885
Total assets ¥1,430,088 ¥1,381,889 $14,273,761
Non-Consolidated Balance Sheets
As of March 31, 2008 and 2007
Non-Consolidated Financial Statements of 2008