Suzuki 2003 Annual Report Download - page 5
Download and view the complete annual report
Please find page 5 of the 2003 Suzuki annual report below. You can navigate through the pages in the report by either clicking on the pages listed below, or by using the keyword search tool below to find specific information within the annual report.-
 1
1 -
 2
2 -
 3
3 -
 4
4 -
 5
5 -
 6
6 -
 7
7 -
 8
8 -
 9
9 -
 10
10 -
 11
11 -
 12
12 -
 13
13 -
 14
14 -
 15
15 -
 16
16 -
17
-
18
-
19
-
20
-
21
-
22
-
23
-
24
-
25
-
26
-
27
-
28
-
29
-
30
-
31
-
32
-
33
-
34
-
35
-
36
-
37
-
38
-
39
-
40
-
41
-
42
-
43
-
44
-
45
-
46
-
47
 |
 |

YEAR IN REVIEW
SUZUKI MOTOR CORPORATION
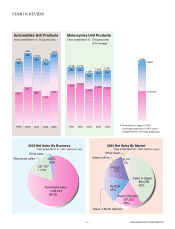
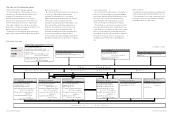
2003 Net Sales By Business 2003 Net Sales By Market
Production in Japan is CBU.
Overseas production is CKD units +
components for overseas production.
Automobiles Unit Products
Years ended March 31 (Thousand units)
Motorcycles Unit Products
Years ended March 31 (Thousand units)
(ATV included)
Total
Japan
Overseas
(Year ended March 31, 2003, millions of yen) (Year ended March 31, 2003, millions of yen)
1,647
786
1999
861
1,278
1,712
434
1,851
864
2000
987
1,739
854
2001
885 1,095
1,540
445
1999 2000 2001
1,237
1,718
480
1,642
864
2002
778
1,223
1,625
402
2002
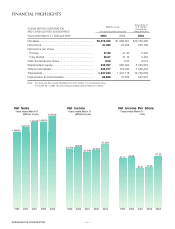
854,269
42%
Sales in Japan
357,532
18%
Sales in Europe
354,234
18%
Sales in North America
349,532
17%
Sales in Asia
99,741
5%
Other Sales
49,275
2.4%
347,797
17.3%
1,618,237
80.3%
Other sales
Automobile sales
Motorcycle sales
1,843
952
2003
891
1,210
1,660
451
2003
4