Suzuki 2003 Annual Report Download - page 41
Download and view the complete annual report
Please find page 41 of the 2003 Suzuki annual report below. You can navigate through the pages in the report by either clicking on the pages listed below, or by using the keyword search tool below to find specific information within the annual report.-
 1
1 -
2
-
3
-
4
-
5
-
6
-
7
-
8
-
9
-
10
-
11
-
12
-
13
-
14
-
15
-
16
-
17
-
18
-
19
-
20
-
21
-
22
-
23
-
24
-
25
-
26
-
27
-
28
-
29
-
30
-
 31
31 -
 32
32 -
 33
33 -
 34
34 -
 35
35 -
 36
36 -
 37
37 -
 38
38 -
 39
39 -
 40
40 -
 41
41 -
 42
42 -
 43
43 -
 44
44 -
 45
45 -
 46
46 -
 47
47
 |
 |

SUZUKI MOTOR CORPORATION
2002
Europe
North America
Asia
Other areas *
2
Consolidated
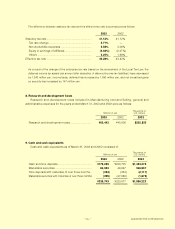
Overseas sales.......... ¥331,473 ¥315,461 ¥136,801 ¥97,602 ¥881,339
Consolidated net sales ................................................................................ 1,668,251
Ratio of overseas sales
to consolidated net sales ...
19.9% 18.9% 8.2% 5.9% 52.8%
2003
Europe
North America
Asia
Other areas *
2
Consolidated
Overseas sales.......... $2,974,479 $2,947,039 $2,907,920 $829,798 $9,659,236
Consolidated net sales ..................................................................................... 16,766,306
Ratio of overseas sales
to consolidated net sales ...
17.7% 17.6% 17.3% 4.9% 57.6%
*2 "Other areas" consists principally of Oceania and Central America.
Thousands of U. S. dollars
2003
Europe
North America
Asia
Other areas *
2
Consolidated
Overseas sales.......... ¥357,532 ¥354,234 ¥349,532 ¥99,741 ¥1,161,040
Consolidated net sales .........................................................................................
2,015,309
Ratio of overseas sales
to consolidated net sales ....
17.7% 17.6% 17.3% 4.9% 57.6%
Millions of yen
(c)Overseas sales
15. Subsequent events
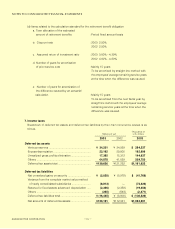
(a) The following plan for the appropriation of retained earnings for the year ended March 31, 2003 was approved
by the ordinary general meeting of shareholders of the Company held on June 27, 2003:
Millions of Thousands of
yen U.S. dollars
Year-end cash dividends .................................................................. ¥2,682 $22,313
Bonuses for directors and corporate auditors ................................... 200 1,663
¥2,882 $23,977
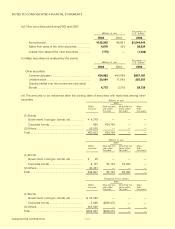
14. Supplementary cash flow information
Thousands of
Millions of yen U.S. dollars
2003 2002 2003
Conversion of convertible bonds .............................. ¥946 ¥212 $7,878
Millions of yen
41