Suzuki 2003 Annual Report Download - page 43
Download and view the complete annual report
Please find page 43 of the 2003 Suzuki annual report below. You can navigate through the pages in the report by either clicking on the pages listed below, or by using the keyword search tool below to find specific information within the annual report.-
 1
1 -
2
-
3
-
4
-
5
-
6
-
7
-
8
-
9
-
10
-
11
-
12
-
13
-
14
-
15
-
16
-
17
-
18
-
19
-
20
-
21
-
22
-
23
-
24
-
25
-
26
-
27
-
28
-
29
-
30
-
31
-
32
-
 33
33 -
 34
34 -
 35
35 -
 36
36 -
 37
37 -
 38
38 -
 39
39 -
 40
40 -
 41
41 -
 42
42 -
 43
43 -
 44
44 -
 45
45 -
 46
46 -
 47
47
 |
 |

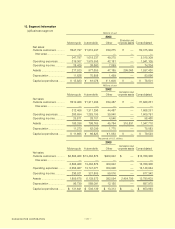
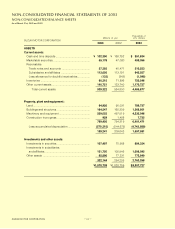
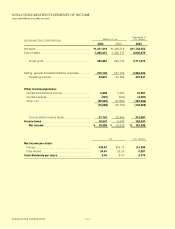
SUZUKI MOTOR CORPORATION
Thousands of
SUZUKI MOTOR CORPORATION Millions of yen U.S. dollars
2003 2002 2003
ASSETS
Current assets:
Cash and time deposits ............................................. ¥ 102,390 ¥ 168,792 $ 851,834
Marketable securities ................................................ 55,178 47,080 459,056
Receivables:
Trade notes and accounts ..................................... 37,292 40,471 310,253
Subsidiaries and affiliates ...................................... 113,656 113,191 945,557
Less allowance for doubtful receivables ................ (132) (343) (1,098)
Inventories ................................................................. 90,215 71,896 750,546
Other current assets .................................................. 140,721 123,740 1,170,727
Total current assets 539,322 564,830 4,486,877
Property, plant and equipment:
Land ........................................................................... 94,926 95,031 789,737
Buildings and structures ............................................ 164,547 160,309 1,368,951
Machinery and equipment ......................................... 509,052 497,519 4,235,046
Construction in progress ........................................... 929 1,458 7,735
769,456 754,319 6,401,471
Less accumulated depreciation ............................. (570,215) (544,675) (4,743,889)
199,241 209,643 1,657,581
Investments and other assets:
Investments in securities ........................................... 107,497 70,958 894,324
Investments in subsidiaries
and affiliates ........................................................... 131,750 105,946 1,096,095
Other assets .............................................................. 92,896 77,331 772,849
332,144 254,235 2,763,268
¥1,070,708 ¥1,028,709 $8,907,727
NON-CONSOLIDATED FINANCIAL STATEMENTS OF 2003
NON-CONSOLIDATED BALANCE SHEETS
As of March 31st, 2003 and 2002
43