Suzuki 2003 Annual Report Download - page 30
Download and view the complete annual report
Please find page 30 of the 2003 Suzuki annual report below. You can navigate through the pages in the report by either clicking on the pages listed below, or by using the keyword search tool below to find specific information within the annual report.-
 1
1 -
2
-
3
-
4
-
5
-
6
-
7
-
8
-
9
-
10
-
11
-
12
-
13
-
14
-
15
-
16
-
17
-
18
-
19
-
 20
20 -
 21
21 -
 22
22 -
 23
23 -
 24
24 -
 25
25 -
 26
26 -
 27
27 -
 28
28 -
 29
29 -
 30
30 -
 31
31 -
 32
32 -
 33
33 -
 34
34 -
 35
35 -
 36
36 -
 37
37 -
 38
38 -
 39
39 -
 40
40 -
41
-
42
-
43
-
44
-
45
-
46
-
47
 |
 |

SUZUKI MOTOR CORPORATION
Millions of yen
2002
Millions of yen
2003
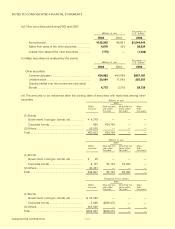
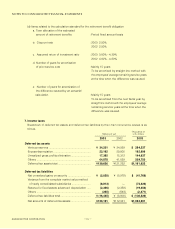
4. Marketable securities and investments in securities
(a) Marketable securities and investments in securities quoted at an exchange as of March 31, 2003
and 2002
Those whose amount for BS exceeds acquisition cost
(1) Stocks .............................................................. ¥26,092 ¥39,110 ¥13,017
(2) Bonds .............................................................. 13,199 13,222 22
(3) Others .............................................................. — — —
Sub Total ¥39,292 ¥52,332 ¥13,039
Those whose amount for BS does not exceed acquisition cost
(1) Stocks ............................................................. ¥ 1,964 ¥ 1,848 ¥ (116)
(2) Bonds ............................................................. 25,000 24,724 (275)
(3) Others ............................................................. 8 6 (1)
Sub Total ¥26,972 ¥26,579 ¥ (393)
Total ¥66,265 ¥78,912 ¥12,646
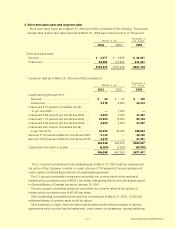
Acquisition
Cost Amounts for
BS Valuation
Those whose amount for BS exceeds acquisition cost
(1) Stocks ............................................................. ¥24,625 ¥40,817 ¥16,191
(2) Bonds ............................................................. 2,188 2,217 29
(3) Others ............................................................. — — —
Sub Total ¥26,813 ¥43,034 ¥16,221
Those whose amount for BS does not exceed acquisition cost
(1) Stocks ............................................................. ¥10,667 ¥ 9,176 ¥
(1,490)
(2) Bonds ............................................................. 15,997 15,840 (156)
(3) Others ............................................................. 5 4 (0)
Sub Total ¥26,669 ¥25,021 ¥
(1,647)
Total ¥53,482 ¥68,056 ¥14,573
Acquisition
Cost Amounts for
BS Valuation
Thousands of U.S. dollars
2003
Those whose amount for BS exceeds acquisition cost
(1) Stocks ............................................................. $217,079 $325,375 $108,295
(2) Bonds ............................................................. 109,814 110,003 188
(3) Others ............................................................. — — —
Sub Total $326,894 $435,378 $108,484
Those whose amount for BS does not exceed acquisition cost
(1) Stocks ............................................................. $ 16,343 $ 15,377 $
(966)
(2) Bonds ............................................................. 207,986 205,697 (2,289)
(3) Others ............................................................. 69 55 (14)
Sub Total $224,400 $221,130 $
(3,269)
Total $551,294 $656,508 $105,214
Acquisition
Cost Amounts for
BS Valuation
30