Suzuki 2003 Annual Report Download - page 40
Download and view the complete annual report
Please find page 40 of the 2003 Suzuki annual report below. You can navigate through the pages in the report by either clicking on the pages listed below, or by using the keyword search tool below to find specific information within the annual report.-
 1
1 -
2
-
3
-
4
-
5
-
6
-
7
-
8
-
9
-
10
-
11
-
12
-
13
-
14
-
15
-
16
-
17
-
18
-
19
-
20
-
21
-
22
-
23
-
24
-
25
-
26
-
27
-
28
-
29
-
 30
30 -
 31
31 -
 32
32 -
 33
33 -
 34
34 -
 35
35 -
 36
36 -
 37
37 -
 38
38 -
 39
39 -
 40
40 -
 41
41 -
 42
42 -
 43
43 -
 44
44 -
 45
45 -
 46
46 -
 47
47
 |
 |

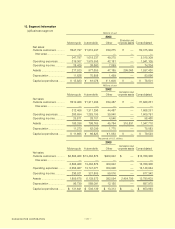
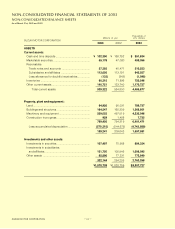
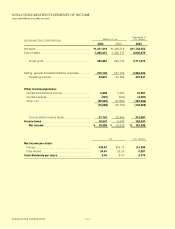
SUZUKI MOTOR CORPORATION
Millions of yen
2003
Elimination and
Japan Europe
North America
Asia
Other areas*1
corporate assets
Consolidated
Net sales:
Outside customers ......
¥1,125,144 ¥ 294,694 ¥ 302,594 ¥ 270,449 ¥22,426 ¥ — ¥2,015,309
Inter-area.....................
415,479 2,098 596 15,218 23 (433,415) —
1,540,623 296,792 303,191 285,667 22,450 (433,415) 2,015,309
Operating expenses .......
1,473,383 293,601 302,777 278,611 21,948 (430,217) 1,941,105
Operating income ...........
¥ 66,240 ¥ 3,191 ¥ 414 ¥ 7,055 ¥ 501 ¥ (3,198) ¥ 74,204
Assets .............................
¥ 857,439 ¥ 145,780 ¥ 67,731 ¥ 232,231 ¥ 9,942 ¥ 224,305 ¥1,537,430
Net sales:
Outside customers ......
¥1,066,639 ¥ 275,116 ¥267,182 ¥ 36,884 ¥22,428 ¥ — ¥1,688,251
Inter-area.....................
370,363 1,305 149 1,159 — (372,977) —
1,437,002 276,421 267,332 38,043 22,428 (372,977) 1,668,251
Operating expenses .......
1,380,871 273,911 266,462 36,618 22,665 (370,737) 1,609,791
Operating income ...........
¥ 56,131 ¥ 2,510 ¥ 869 ¥ 1,425 ¥ (236) ¥ (2,239) ¥ 58,460
Assets .............................
¥ 851,483 ¥ 151,342 ¥ 54,376 ¥ 24,411 ¥11,745 ¥ 254,360 ¥1,347,718
Net sales:
Outside customers ......
$9,360,605 $2,451,701 $2,517,424 $2,249,995 $186,579 $ — $16,766,305
Inter-area.....................
3,456,564 17,455 4,965 126,606 192 (3,605,785) —
12,817,170 2,469,156 2,522,390 2,376,601 186,772 (3,605,785) 16,766,305
Operating expenses .......
12,266,086 2,442,607 2,518,944 2,317,900 182,603 (3,579,177) 16,148,964
Operating income ...........
$ 551,083 $ 26,549 $ 3,445 $ 58,701 $ 4,169 $ (26,608) $ 617,341
Assets .............................
$7,133,436 $1,212,816 $ 563,489 $1,932,038 $ 82,716 $1,866,105 $12,790,603
(b)Geographical segment
Thousands of U.S. dollars
2003
Elimination and
Japan Europe
North America
Asia Other areas*1
corporate assets
Consolidated
*1 "Other areas" consists principally of Oceania, South America.
NOTES TO CONSOLIDATED FINANCIAL STATEMENTS
Millions of yen
2002
Elimination and
Japan Europe
North America
Asia
Other areas*1
corporate assets
Consolidated
40