Suzuki 2003 Annual Report Download - page 39
Download and view the complete annual report
Please find page 39 of the 2003 Suzuki annual report below. You can navigate through the pages in the report by either clicking on the pages listed below, or by using the keyword search tool below to find specific information within the annual report.-
 1
1 -
2
-
3
-
4
-
5
-
6
-
7
-
8
-
9
-
10
-
11
-
12
-
13
-
14
-
15
-
16
-
17
-
18
-
19
-
20
-
21
-
22
-
23
-
24
-
25
-
26
-
27
-
28
-
 29
29 -
 30
30 -
 31
31 -
 32
32 -
 33
33 -
 34
34 -
 35
35 -
 36
36 -
 37
37 -
 38
38 -
 39
39 -
 40
40 -
 41
41 -
 42
42 -
 43
43 -
 44
44 -
 45
45 -
 46
46 -
 47
47
 |
 |
SUZUKI MOTOR CORPORATION
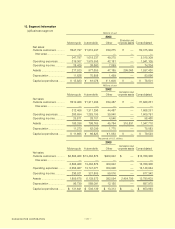
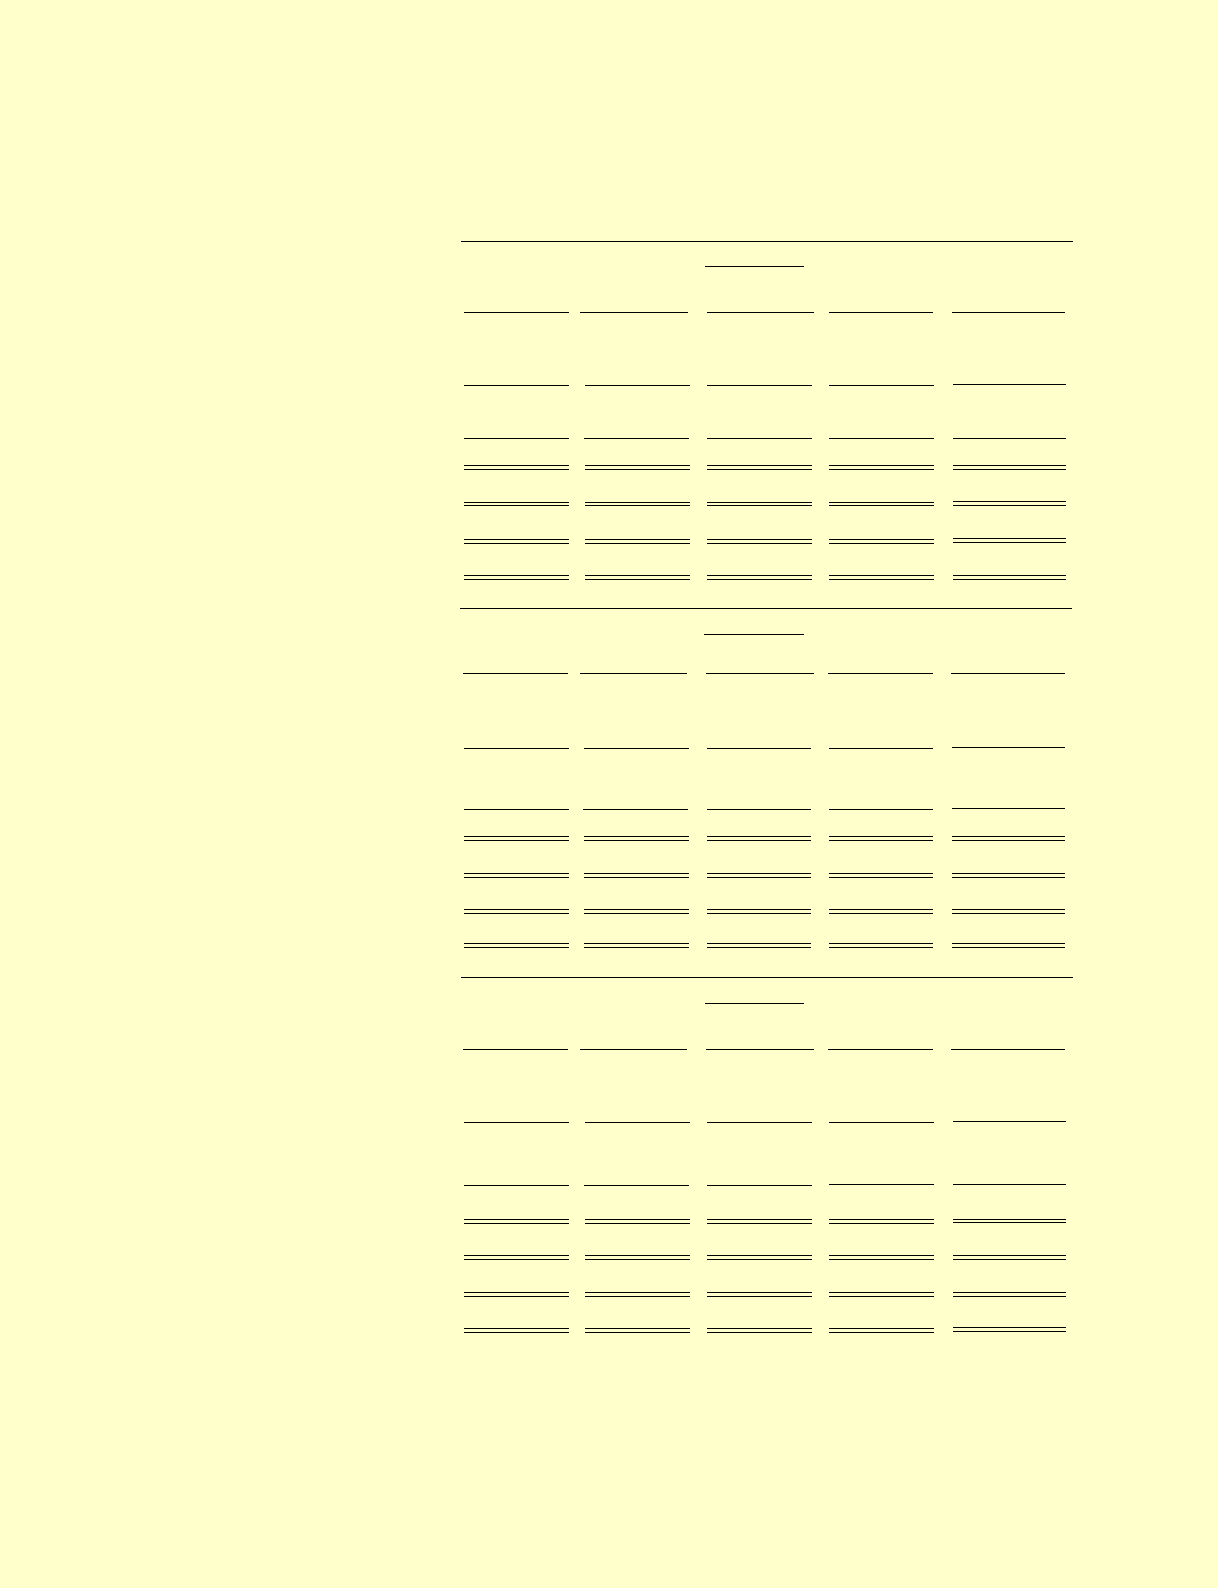
Millions of yen
2003
Elimination and
Motorcycle Automobile Other
corporate assets
Consolidated
Net sales:
Outside customers ........... ¥347,797 ¥1,618,237 ¥49,275 ¥ — ¥2,015,309
Inter-area....................... — — — — —
347,797 1,618,237 49,275 — 2,015,309
Operating expenses ........ 319,367 1,579,556 42,181 — 1,941,105
Operating income ............ 28,429 38,680 7,093 — 74,204
Assets .............................. 217,523 977,655 47,185 295,066 1,537,430
Depreciation..................... 11,628 70,808 1,459 — 83,896
Capital expenditures ........ ¥ 15,823 ¥ 61,078 ¥ 1,600 ¥ — ¥ 78,501
Millions of yen
2002
Elimination and
Motorcycle Automobile Other
corporate assets
Consolidated
Net sales:
Outside customers ........... ¥312,466 ¥1,311,296 ¥44,487 ¥ — ¥1,668,251
Inter-area....................... — — — — —
312,466 1,311,296 44,487 — 1,668,251
Operating expenses ........ 286,654 1,283,195 39,940 — 1,609,791
Operating income ............ 25,811 28,101 4,546 — 58,460
Assets .............................. 186,336 798,765 45,784 316,831 1,347,718
Depreciation..................... 11,273 62,039 1,770 — 75,083
Capital expenditures ........ ¥ 11,665 ¥ 66,825 ¥ 1,033 ¥ — ¥ 79,523
Thousands of U.S. dollars
2003
Elimination and
Motorcycle Automobile Other
corporate assets
Consolidated
Net sales:
Outside customers ........... $2,893,488 $13,462,876 $409,942 $ — $16,766,306
Inter-area....................... — — — — —
2,893,488 13,462,876 409,942 — 16,766,306
Operating expenses ........ 2,656,967 13,141,071 350,926 — 16,148,964
Operating income ............ 236,521 321,805 59,016 — 617,342
Assets .............................. 1,809,675 8,133,573 392,554 2,454,799 12,790,603
Depreciation..................... 96,739 589,091 12,138 — 697,970
Capital expenditures ........ $ 131,641 $ 508,139 $ 13,313 $ — $ 653,093
13. Segment Information
(a)Business segment
39