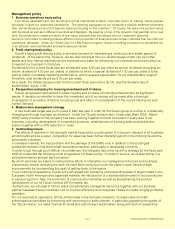
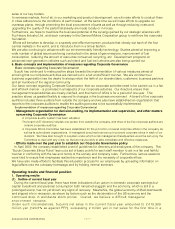
Suzuki 2003 Annual Report Download - page 19
Download and view the complete annual report
Please find page 19 of the 2003 Suzuki annual report below. You can navigate through the pages in the report by either clicking on the pages listed below, or by using the keyword search tool below to find specific information within the annual report.-
 1
1 -
2
-
3
-
4
-
5
-
6
-
7
-
8
-
 9
9 -
 10
10 -
 11
11 -
 12
12 -
 13
13 -
 14
14 -
 15
15 -
 16
16 -
 17
17 -
 18
18 -
 19
19 -
 20
20 -
 21
21 -
 22
22 -
 23
23 -
 24
24 -
 25
25 -
 26
26 -
 27
27 -
 28
28 -
 29
29 -
30
-
31
-
32
-
33
-
34
-
35
-
36
-
37
-
38
-
39
-
40
-
41
-
42
-
43
-
44
-
45
-
46
-
47
 |
 |

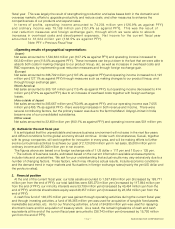
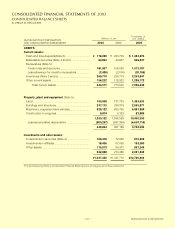
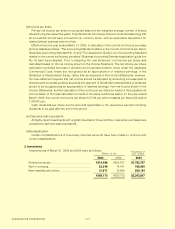
SUZUKI MOTOR CORPORATION
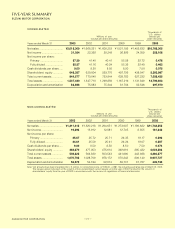
Years ended March 31 2003 2002 2001 2000 1999 2003
Net sales ............................... ¥2,015,309 ¥1,668,251 ¥1,600,253 ¥1,521,192 ¥1,455,832 $16,766,305
Net income ............................ 31,024 22,392 20,248 26,886 24,359 258,106
Net income per share:
Primary .............................. 57.29 41.40 40.41 55.58 52.72 0.476
Fully diluted ....................... 55.57 41.16 40.24 55.32 52.40 0.462
Cash dividends per share..... 9.00 8.50 8.50 8.50 7.50 0.075
Shareholders' equity ............. 648,357 620,004 593,770 497,756 438,047 5,393,987
Total current assets............... 844,577 773,040 723,844 628,782 627,232 7,026,435
Total assets ........................... 1,537,430 1,347,718 1,299,859 1,167,216 1,131,849 12,790,603
Depreciation and amortization
83,896 75,083 75,344 81,784 82,546 697,970
FIVE-YEAR SUMMARY
SUZUKI MOTOR CORPORATION
CONSOLIDATED
NON-CONSOLIDATED
Thousands of
U.S. dollars
(except per
share amounts)
Years ended March 31 2003 2002 2001 2000 1999 2003
Net sales ............................... ¥1,411,418 ¥1,320,218 ¥1,294,651 ¥1,273,907 ¥1,189,622 $11,742,252
Net income ............................ 19,393 13,912 12,881 12,745 8,855 161,346
Net income per share:
Primary .............................. 35.67 25.72 25.71 26.35 19.17 0.296
Fully diluted ....................... 34.61 25.59 25.61 26.24 19.07 0.287
Cash dividends per share..... 9.00 8.50 8.50 8.50 7.50 0.074
Shareholders' equity ............. 483,670 477,053 475,614 392,619 295,422 4,023,883
Total current assets............... 539,322 564,830 503,543 441,690 442,938 4,486,877
Total assets ........................... 1,070,708 1,028,709 978,172 870,242 806,140 8,907,727
Depreciation and amortization
53,578 54,194 52,814 59,701 61,787 445,740
Note: Yen amounts have been translated into U.S. dollars, for convenience only, at ¥120.20 = US$1, the prevailing exchange rate on March 31, 2003.
The treasury stock indicated on the column of non-consolidated current assets up to the year of 2001 is listed on the column of
shareholders' equity from the year of 2002 in accordance with the revision of regulations of financial statements.
Millions of yen
(except per share amounts)
Thousands of
U.S. dollars
(except per
share amounts)
Millions of yen
(except per share amounts)
19