Salesforce.com 2008 Annual Report Download - page 92
Download and view the complete annual report
Please find page 92 of the 2008 Salesforce.com annual report below. You can navigate through the pages in the report by either clicking on the pages listed below, or by using the keyword search tool below to find specific information within the annual report.-
 1
1 -
2
-
3
-
4
-
5
-
6
-
7
-
8
-
9
-
10
-
11
-
12
-
13
-
14
-
15
-
16
-
17
-
18
-
19
-
20
-
21
-
22
-
23
-
24
-
25
-
26
-
27
-
28
-
29
-
30
-
31
-
32
-
33
-
34
-
35
-
36
-
37
-
38
-
39
-
40
-
41
-
42
-
43
-
44
-
45
-
46
-
47
-
48
-
49
-
50
-
51
-
52
-
53
-
54
-
55
-
56
-
57
-
58
-
59
-
60
-
61
-
62
-
63
-
64
-
65
-
66
-
67
-
68
-
69
-
70
-
71
-
72
-
73
-
74
-
75
-
76
-
77
-
78
-
79
-
80
-
81
-
 82
82 -
 83
83 -
 84
84 -
 85
85 -
 86
86 -
 87
87 -
 88
88 -
 89
89 -
 90
90 -
 91
91 -
 92
92 -
 93
93 -
 94
94 -
 95
95 -
 96
96 -
 97
97 -
 98
98 -
 99
99 -
 100
100 -
 101
101 -
 102
102 -
103
-
104
-
105
-
106
-
107
-
108
-
109
-
110
-
111
-
112
-
113
-
114
-
115
-
116
-
117
-
118
-
119
-
120
-
121
-
122
-
123
-
124
-
125
-
126
-
127
-
128
-
129
-
130
-
131
-
132
-
133
-
134
-
135
-
136
-
137
-
138
-
139
-
140
-
141
-
142
-
143
-
144
-
145
-
146
-
147
-
148
-
149
-
150
 |
 |

Table of Contents
salesforce.com, inc.
Notes to Consolidated Financial Statements—(Continued)
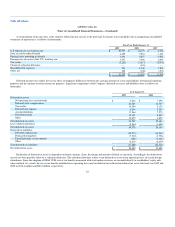
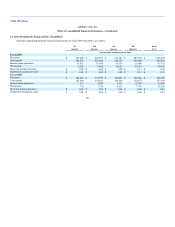
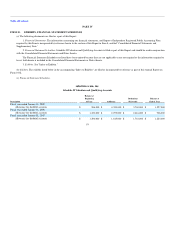
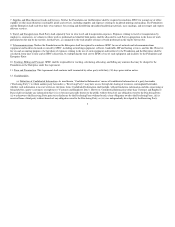
12. Selected Quarterly Financial Data (Unaudited)
Selected summarized quarterly financial information for fiscal 2009 and 2008 is as follows:
1st
Quarter
2nd
Quarter
3rd
Quarter
4th
Quarter
Fiscal
Year
(in thousands, except per share data)
Fiscal 2009
Revenues $ 247,622 $ 263,077 $ 276,487 $ 289,583 $ 1,076,769
Gross profit 196,324 208,986 220,139 230,849 856,298
Income from operations 15,421 16,098 16,133 16,090 63,742
Net income 9,555 9,996 10,124 13,753 43,428
Basic net income per share $ 0.08 $ 0.08 $ 0.08 $ 0.11 $ 0.36
Diluted net income per share $ 0.08 $ 0.08 $ 0.08 $ 0.11 $ 0.35
Fiscal 2008
Revenues $ 162,412 $ 176,579 $ 192,803 $ 216,906 $ 748,700
Gross profit 123,245 135,167 148,522 170,175 577,109
Income from operations 114 3,347 6,118 10,730 20,309
Net income 730 3,735 6,512 7,379 18,356
Basic net income per share $ 0.01 $ 0.03 $ 0.06 $ 0.06 $ 0.16
Diluted net income per share $ 0.01 $ 0.03 $ 0.05 $ 0.06 $ 0.15
89