Salesforce.com 2008 Annual Report Download - page 82
Download and view the complete annual report
Please find page 82 of the 2008 Salesforce.com annual report below. You can navigate through the pages in the report by either clicking on the pages listed below, or by using the keyword search tool below to find specific information within the annual report.-
 1
1 -
2
-
3
-
4
-
5
-
6
-
7
-
8
-
9
-
10
-
11
-
12
-
13
-
14
-
15
-
16
-
17
-
18
-
19
-
20
-
21
-
22
-
23
-
24
-
25
-
26
-
27
-
28
-
29
-
30
-
31
-
32
-
33
-
34
-
35
-
36
-
37
-
38
-
39
-
40
-
41
-
42
-
43
-
44
-
45
-
46
-
47
-
48
-
49
-
50
-
51
-
52
-
53
-
54
-
55
-
56
-
57
-
58
-
59
-
60
-
61
-
62
-
63
-
64
-
65
-
66
-
67
-
68
-
69
-
70
-
71
-
 72
72 -
 73
73 -
 74
74 -
 75
75 -
 76
76 -
 77
77 -
 78
78 -
 79
79 -
 80
80 -
 81
81 -
 82
82 -
 83
83 -
 84
84 -
 85
85 -
 86
86 -
 87
87 -
 88
88 -
 89
89 -
 90
90 -
 91
91 -
 92
92 -
93
-
94
-
95
-
96
-
97
-
98
-
99
-
100
-
101
-
102
-
103
-
104
-
105
-
106
-
107
-
108
-
109
-
110
-
111
-
112
-
113
-
114
-
115
-
116
-
117
-
118
-
119
-
120
-
121
-
122
-
123
-
124
-
125
-
126
-
127
-
128
-
129
-
130
-
131
-
132
-
133
-
134
-
135
-
136
-
137
-
138
-
139
-
140
-
141
-
142
-
143
-
144
-
145
-
146
-
147
-
148
-
149
-
150
 |
 |

Table of Contents
salesforce.com, inc.
Notes to Consolidated Financial Statements—(Continued)
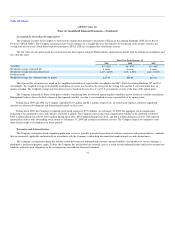
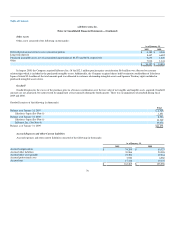
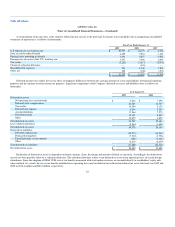
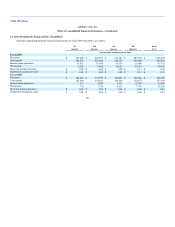
The following table summarizes information about stock options outstanding as of January 31, 2009:
Options Outstanding Options Vested
Range of Exercise
Prices
Number
Outstanding
Weighted-
Average
Remaining
Contractual
Life (Years)
Weighted-
Average
Exercise
Price
Number of
Shares
Weighted-
Average
Exercise
Price
$13.89 2,318,177 4.80 $ 7.62 2,315,224 $ 7.61
$14.39 to $25.19 1,293,066 5.51 19.57 1,072,379 19.24
$25.97 3,360,833 4.73 25.97 — —
$27.20 to $36.34 2,277,312 3.33 31.93 1,181,209 32.04
$36.90 to $52.28 2,703,288 3.29 43.78 1,053,682 42.16
$52.43 to $52.76 2,163,794 3.72 52.56 437,531 52.48
$54.22 to $70.86 801,050 4.04 62.23 54,179 58.80
14,917,520 4.15 $ 32.51 6,114,204 $ 23.99
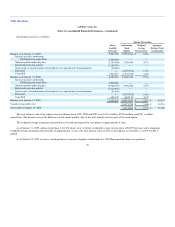
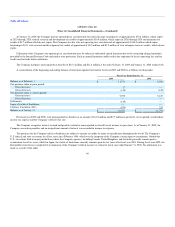
Restricted stock unit activity is as follows:
Restricted Stock Units Outstanding
Outstanding
Weighted-
Average
Exercise Price
Aggregate
Intrinsic
Value
(in thousands)
Balance as of January 31, 2007 841,678 $ —
Granted 1,326,520 0.001
Cancelled (216,873) 0.001
Vested and converted to shares (234,035) 0.001
Balance as of January 31, 2008 1,717,290 0.001
Granted 1,475,314 0.001
Cancelled (157,743) 0.001
Vested and converted to shares (535,710) 0.001
Balance as of January 31, 2009 2,499,151 $ 0.001 $ 66,502
Expected to vest 2,090,074 $ 55,617
The restricted stock units, which entitles the holder to one share of common stock for each restricted stock unit upon vesting, have an exercise price of
$0.001 per share, which is equal to the par value of the Company's common stock, and vest over 4 years. The Company first awarded restricted stock units in
May 2006.
The weighted-average fair value of the restricted stock units issued in fiscal 2009 and 2008 was $39.41 and $48.26, respectively.
The Company realized tax benefits of $42.0 million from the exercise, sale or vesting of stock awards during fiscal 2009.
79