Salesforce.com 2008 Annual Report Download - page 62
Download and view the complete annual report
Please find page 62 of the 2008 Salesforce.com annual report below. You can navigate through the pages in the report by either clicking on the pages listed below, or by using the keyword search tool below to find specific information within the annual report.-
 1
1 -
2
-
3
-
4
-
5
-
6
-
7
-
8
-
9
-
10
-
11
-
12
-
13
-
14
-
15
-
16
-
17
-
18
-
19
-
20
-
21
-
22
-
23
-
24
-
25
-
26
-
27
-
28
-
29
-
30
-
31
-
32
-
33
-
34
-
35
-
36
-
37
-
38
-
39
-
40
-
41
-
42
-
43
-
44
-
45
-
46
-
47
-
48
-
49
-
50
-
51
-
 52
52 -
 53
53 -
 54
54 -
 55
55 -
 56
56 -
 57
57 -
 58
58 -
 59
59 -
 60
60 -
 61
61 -
 62
62 -
 63
63 -
 64
64 -
 65
65 -
 66
66 -
 67
67 -
 68
68 -
 69
69 -
 70
70 -
 71
71 -
 72
72 -
73
-
74
-
75
-
76
-
77
-
78
-
79
-
80
-
81
-
82
-
83
-
84
-
85
-
86
-
87
-
88
-
89
-
90
-
91
-
92
-
93
-
94
-
95
-
96
-
97
-
98
-
99
-
100
-
101
-
102
-
103
-
104
-
105
-
106
-
107
-
108
-
109
-
110
-
111
-
112
-
113
-
114
-
115
-
116
-
117
-
118
-
119
-
120
-
121
-
122
-
123
-
124
-
125
-
126
-
127
-
128
-
129
-
130
-
131
-
132
-
133
-
134
-
135
-
136
-
137
-
138
-
139
-
140
-
141
-
142
-
143
-
144
-
145
-
146
-
147
-
148
-
149
-
150
 |
 |

Table of Contents
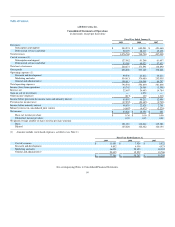
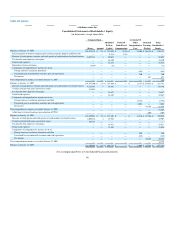
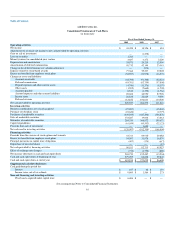
salesforce.com, inc.
Consolidated Statements of Operations
(in thousands, except per share data)
Fiscal Year Ended January 31,
2009 2008 2007
Revenues:
Subscription and support $ 984,574 $ 680,581 $ 451,660
Professional services and other 92,195 68,119 45,438
Total revenues 1,076,769 748,700 497,098
Cost of revenues (1):
Subscription and support 127,082 91,268 61,457
Professional services and other 93,389 80,323 57,433
Total cost of revenues 220,471 171,591 118,890
Gross profit 856,298 577,109 378,208
Operating expenses (1):
Research and development 99,530 63,812 44,614
Marketing and sales 534,413 376,480 252,935
General and administrative 158,613 116,508 84,257
Total operating expenses 792,556 556,800 381,806
Income (loss) from operations 63,742 20,309 (3,598)
Interest, net 22,667 24,493 14,784
Gain on sale of investment — 1,272 —
Other income (expense) (817) 139 1,310
Income before provision for income taxes and minority interest 85,592 46,213 12,496
Provision for income taxes (37,557) (23,385) (9,795)
Income before minority interest 48,035 22,828 2,701
Minority interest in consolidated joint venture (4,607) (4,472) (2,220)
Net income $ 43,428 $ 18,356 $ 481
Basic net income per share $ 0.36 $ 0.16 $ 0.00
Diluted net income per share 0.35 0.15 0.00
Weighted-average number of shares used in per share amounts:
Basic 121,183 116,840 112,386
Diluted 125,228 122,422 120,154
(1) Amounts include stock-based expenses, as follows (see Note 1):
Fiscal Year Ended January 31,
2009 2008 2007
Cost of revenues $ 11,051 $ 7,926 $ 5,522
Research and development 9,852 6,336 4,523
Marketing and sales 36,028 25,423 18,392
General and administrative 20,435 15,522 10,768
$ 77,366 $ 55,207 $ 39,205
See accompanying Notes to Consolidated Financial Statements.
59