Salesforce.com 2008 Annual Report Download - page 52
Download and view the complete annual report
Please find page 52 of the 2008 Salesforce.com annual report below. You can navigate through the pages in the report by either clicking on the pages listed below, or by using the keyword search tool below to find specific information within the annual report.-
 1
1 -
2
-
3
-
4
-
5
-
6
-
7
-
8
-
9
-
10
-
11
-
12
-
13
-
14
-
15
-
16
-
17
-
18
-
19
-
20
-
21
-
22
-
23
-
24
-
25
-
26
-
27
-
28
-
29
-
30
-
31
-
32
-
33
-
34
-
35
-
36
-
37
-
38
-
39
-
40
-
41
-
 42
42 -
 43
43 -
 44
44 -
 45
45 -
 46
46 -
 47
47 -
 48
48 -
 49
49 -
 50
50 -
 51
51 -
 52
52 -
 53
53 -
 54
54 -
 55
55 -
 56
56 -
 57
57 -
 58
58 -
 59
59 -
 60
60 -
 61
61 -
 62
62 -
63
-
64
-
65
-
66
-
67
-
68
-
69
-
70
-
71
-
72
-
73
-
74
-
75
-
76
-
77
-
78
-
79
-
80
-
81
-
82
-
83
-
84
-
85
-
86
-
87
-
88
-
89
-
90
-
91
-
92
-
93
-
94
-
95
-
96
-
97
-
98
-
99
-
100
-
101
-
102
-
103
-
104
-
105
-
106
-
107
-
108
-
109
-
110
-
111
-
112
-
113
-
114
-
115
-
116
-
117
-
118
-
119
-
120
-
121
-
122
-
123
-
124
-
125
-
126
-
127
-
128
-
129
-
130
-
131
-
132
-
133
-
134
-
135
-
136
-
137
-
138
-
139
-
140
-
141
-
142
-
143
-
144
-
145
-
146
-
147
-
148
-
149
-
150
 |
 |

Table of Contents
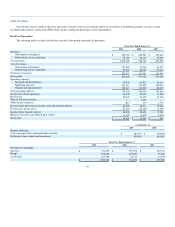
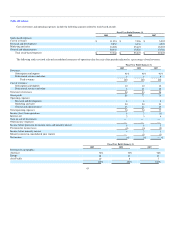
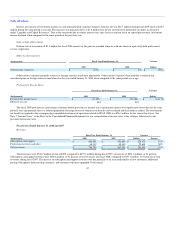
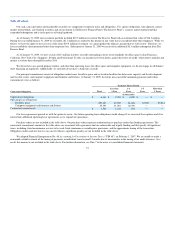
Marketing and sales expenses were $376.5 million, or 50 percent of total revenues, during fiscal 2008, compared to $252.9 million, or 51 percent of
total revenues, during fiscal 2007, an increase of $123.6 million. The increase in absolute dollars was primarily due to increases of $85.9 million in employee-
related costs, $7.0 million in stock-based expenses, $10.8 million in advertising costs, $2.2 million in marketing and event costs, $1.7 million in partner
referral fees and $13.9 million in allocated overhead. Our marketing and sales headcount increased by 27 percent between January 31, 2007 and January 31,
2008 as we hired additional sales personnel to focus on adding new customers and increasing penetration within our existing customer base.
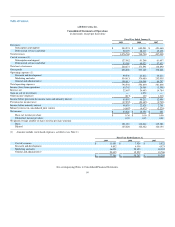
General and Administrative.
Fiscal Year Ended January 31, Variance
Dollars
(In thousands) 2008 2007
General and administrative $ 116,508 $ 84,257 $ 32,251
Percent of total revenues 16% 17%
General and administrative expenses were $116.5 million, or 16 percent of total revenues, during fiscal 2008, compared to $84.3 million, or 17 percent
of total revenues, during fiscal 2007, an increase of $32.2 million. The increase was primarily due to increases in employee-related costs, stock-based
expenses, infrastructure-related costs, professional and outside service costs and a legal settlement. Our general and administrative headcount increased by 33
percent between January 31, 2007 and January 31, 2008 as we added personnel to support our growth.
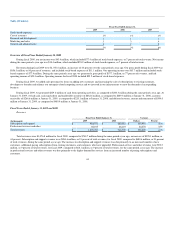
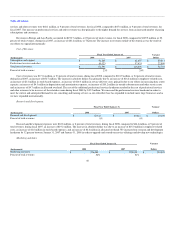
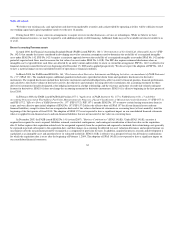
Operating Income (Loss).
Fiscal Year Ended January 31, Variance
Dollars
(In thousands) 2008 2007
Operating income (loss) $ 20,309 $ (3,598) $ 23,907
Percent of total revenues 3% (1)%
Operating income during fiscal 2008 was $20.3 million and included $55.2 million of stock-based expenses related to SFAS 123R. During fiscal 2007,
operating loss was $3.6 million and included $39.2 million of stock-based expenses.
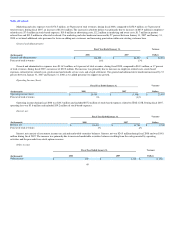
Interest, net.
Fiscal Year Ended January 31, Variance
Dollars
(In thousands) 2008 2007
Interest, net $ 24,493 $ 14,784 $ 9,709
Percent of total revenues 3% 4%
Interest, net consists of investment income on cash and marketable securities balances. Interest, net was $24.5 million during fiscal 2008 and was $14.8
million during fiscal 2007. The increase was primarily due to increased marketable securities balances resulting from the cash generated by operating
activities and the proceeds from stock option exercises.
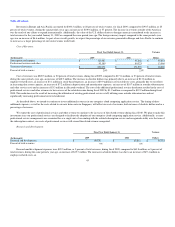
Other income.
Fiscal Year Ended January 31, Variance
Dollars
(In thousands) 2008 2007
Other income $ 139 $ 1,310 $ (1,171)
49