Rite Aid 2015 Annual Report Download - page 44
Download and view the complete annual report
Please find page 44 of the 2015 Rite Aid annual report below. You can navigate through the pages in the report by either clicking on the pages listed below, or by using the keyword search tool below to find specific information within the annual report.-
 1
1 -
2
-
3
-
4
-
5
-
6
-
7
-
8
-
9
-
10
-
11
-
12
-
13
-
14
-
15
-
16
-
17
-
18
-
19
-
20
-
21
-
22
-
23
-
24
-
25
-
26
-
27
-
28
-
29
-
30
-
31
-
32
-
33
-
 34
34 -
 35
35 -
 36
36 -
 37
37 -
 38
38 -
 39
39 -
 40
40 -
 41
41 -
 42
42 -
 43
43 -
 44
44 -
 45
45 -
 46
46 -
 47
47 -
 48
48 -
 49
49 -
 50
50 -
 51
51 -
 52
52 -
 53
53 -
 54
54 -
55
-
56
-
57
-
58
-
59
-
60
-
61
-
62
-
63
-
64
-
65
-
66
-
67
-
68
-
69
-
70
-
71
-
72
-
73
-
74
-
75
-
76
-
77
-
78
-
79
-
80
-
81
-
82
-
83
-
84
-
85
-
86
-
87
-
88
-
89
-
90
-
91
-
92
-
93
-
94
-
95
-
96
-
97
-
98
-
99
-
100
-
101
-
102
-
103
-
104
-
105
-
106
-
107
-
108
-
109
-
110
-
111
-
112
-
113
-
114
-
115
-
116
-
117
-
118
-
119
-
120
-
121
-
122
-
123
-
124
-
125
-
126
-
127
-
128
-
129
-
130
-
131
 |
 |
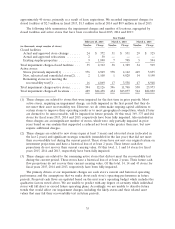
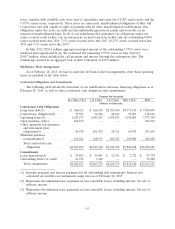
(4) Includes the undiscounted payments for self-insured medical coverage, actuarially determined
undiscounted payments for self-insured workers’ compensation and general liability, and actuarially
determined obligations for defined benefit pension and nonqualified executive retirement plans.
(5) Represents commitments to purchase products and licensing fees from certain vendors.
(6) Represents lease guarantee obligations for 113 former stores related to certain business
dispositions. The respective purchasers assume the obligations and are, therefore, primarily liable
for these obligations.
Obligations in connection with the April 2, 2015 issuance of $1.8 billion of our 6.125% senior
notes due 2023, issued to finance the cash portion of our pending acquisition of EnvisionRx, and
obligations for income tax uncertainties pursuant to ASC 740, ‘‘Income Taxes’’ of approximately
$0.4 million are not included in the table above as we are uncertain as to if or when such amounts may
be settled.
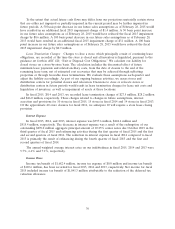
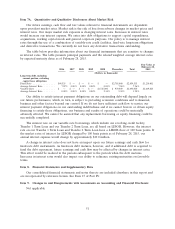
Net Cash Provided By (Used In) Operating, Investing and Financing Activities
Cash flow provided by operating activities was $649.0 million in fiscal 2015. Cash flow was
positively impacted by net income and a decrease in inventory. These cash inflows were partially offset
by a reduction of accounts payable resulting from the inventory reduction and the timing of payments,
cash used in other assets and liabilities, net, due primarily to lower closed store reserves and
self-insurance liability and higher accounts receivable due primarily to increased pharmacy sales and the
timing of payments.
Cash flow provided by operating activities was $702.0 million in fiscal 2014. Cash flow was
positively impacted by net income and a decrease in inventory, partially offset by a reduction of
accounts payable resulting from the inventory reduction and the timing of payments, cash used in other
assets and liabilities, net, due primarily to lower vendor deferred income and pension liability and
higher accounts receivable due primarily to increased pharmacy sales and the timing of payments.
Included in cash used by other assets and liabilities, net is the $26.7 million excess tax benefit relating
to stock option exercise and restricted stock vesting windfalls that was recorded as a component of
income tax benefit and an increase of APIC.
Cash flow provided by operating activities was $819.6 million in fiscal 2013. Cash flow was
positively impacted by net income and a reduction of inventory resulting primarily from recent generic
introductions, generic price reductions, management initiatives to reduce inventory levels and fewer
open stores, and a reduction of accounts receivable due to the timing of payments from third party
payors.
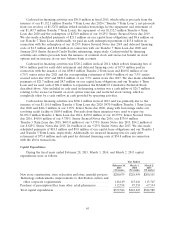
Cash used in investing activities was $593.7 million in fiscal 2015. Cash used for the purchase of
property, plant, and equipment and prescription files was higher than in the prior year due to a higher
investment in Wellness store remodels and prescription file buys. Proceeds from the sale of assets were
lower as compared to the prior year. Also reflected in investing activities are expenditures of
$69.8 million, net of cash acquired, related to the acquisitions of Health Dialog and RediClinic.
Cash used in investing activities was $364.9 million in fiscal 2014. Cash used for the purchase of
property, plant and equipment and prescriptions files was higher than in the prior year due to a higher
investment in Wellness store remodels and prescription file buys, which was partially offset by proceeds
from asset dispositions, sale-leaseback transactions, the sale of lease rights of $8.8 million relating to
one specific store and insurance settlement proceeds of $15.1 million related to buildings and
equipment that were destroyed during hurricane Sandy.
Cash used in investing activities was $346.3 million in fiscal 2013. Cash was used for the purchase
of property, plant and equipment and prescriptions files which was partially offset by proceeds from
asset dispositions and sale-leaseback transactions.
44