Rite Aid 2015 Annual Report Download - page 32
Download and view the complete annual report
Please find page 32 of the 2015 Rite Aid annual report below. You can navigate through the pages in the report by either clicking on the pages listed below, or by using the keyword search tool below to find specific information within the annual report.-
 1
1 -
2
-
3
-
4
-
5
-
6
-
7
-
8
-
9
-
10
-
11
-
12
-
13
-
14
-
15
-
16
-
17
-
18
-
19
-
20
-
21
-
 22
22 -
 23
23 -
 24
24 -
 25
25 -
 26
26 -
 27
27 -
 28
28 -
 29
29 -
 30
30 -
 31
31 -
 32
32 -
 33
33 -
 34
34 -
 35
35 -
 36
36 -
 37
37 -
 38
38 -
 39
39 -
 40
40 -
 41
41 -
 42
42 -
43
-
44
-
45
-
46
-
47
-
48
-
49
-
50
-
51
-
52
-
53
-
54
-
55
-
56
-
57
-
58
-
59
-
60
-
61
-
62
-
63
-
64
-
65
-
66
-
67
-
68
-
69
-
70
-
71
-
72
-
73
-
74
-
75
-
76
-
77
-
78
-
79
-
80
-
81
-
82
-
83
-
84
-
85
-
86
-
87
-
88
-
89
-
90
-
91
-
92
-
93
-
94
-
95
-
96
-
97
-
98
-
99
-
100
-
101
-
102
-
103
-
104
-
105
-
106
-
107
-
108
-
109
-
110
-
111
-
112
-
113
-
114
-
115
-
116
-
117
-
118
-
119
-
120
-
121
-
122
-
123
-
124
-
125
-
126
-
127
-
128
-
129
-
130
-
131
 |
 |

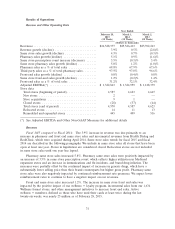
Fiscal 2014 compared to Fiscal 2013: The 0.5% increase in revenue was due primarily to an
increase in pharmacy same store sales, partially offset by a decrease in front end sales. The increase in
pharmacy same stores sales was driven primarily by brand drug inflation, partially offset by a decrease
in same store prescription count, negative impact from generic introductions and continued
reimbursement rate pressures.
Pharmacy same store sales increased 1.2%. Pharmacy same store sales were positively impacted by
brand drug inflation. The increases were partially offset by a decrease of 0.3% in same store
prescription count and the continued impact of generic drug introductions, which have a substantially
lower selling price than their brand counterparts but higher gross profit. Pharmacy same store sales
were also negatively impacted by continued reimbursement rate pressures.
Front end same store sales decreased 0.2%. The decrease in same store front end sales was
impacted by consumer spending habits and the heavy promotional environment, partially offset by the
positive impact of our wellness + loyalty program, incremental sales from our Wellness format stores,
and other management initiatives to increase front end sales.
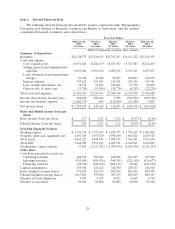
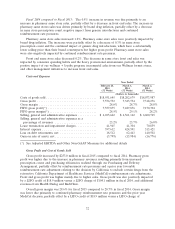
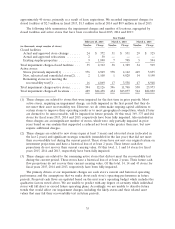
Costs and Expenses
Year Ended
February 28, March 1, March 2,
2015 2014 2013
(52 Weeks) (52 Weeks) (52 Weeks)
(Dollars in thousands)
Costs of goods sold ............................. $18,951,645 $18,202,679 $18,073,987
Gross profit .................................. 7,576,732 7,323,734 7,318,276
Gross margin ................................. 28.6% 28.7% 28.8%
FIFO gross profit(*) ............................ 7,557,875 7,427,876 7,170,394
FIFO gross margin(*) ........................... 28.5% 29.1% 28.2%
Selling, general and administrative expenses ........... $ 6,695,642 $ 6,561,162 $ 6,600,765
Selling, general and administrative expenses as a
percentage of revenues ........................ 25.2% 25.7% 26.0%
Lease termination and impairment charges ............ 41,945 41,304 70,859
Interest expense ............................... 397,612 424,591 515,421
Loss on debt retirements, net ..................... 18,512 62,443 140,502
Gain on sale of assets, net ........................ (3,799) (15,984) (16,776)
(*) See Adjusted EBITDA and Other Non-GAAP Measures for additional details
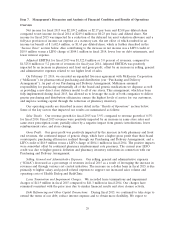
Gross Profit and Cost of Goods Sold
Gross profit increased by $253.0 million in fiscal 2015 compared to fiscal 2014. Pharmacy gross
profit was higher due to the increase in pharmacy revenues resulting primarily from increased
prescription count, and purchasing efficiencies realized through our Purchasing and Delivery
Arrangement, partially offset by reimbursement rate pressures and a prior year favorable
reimbursement rate adjustment relating to the decision by California to exclude certain drugs from the
retroactive California Department of Healthcare Services (MediCal) reimbursement rate adjustments.
Front end gross profit was higher mainly due to higher sales. Gross profit was also positively impacted
by a LIFO credit of $18.9 million versus a LIFO charge of $104.1 million in fiscal 2014, and additional
revenues from Health Dialog and RediClinic.
Overall gross margin was 28.6% for fiscal 2015 compared to 28.7% in fiscal 2014. Gross margin
was lower due primarily to continued pharmacy reimbursement rate pressures and the prior year
MediCal decision, partially offset by a LIFO credit of $18.9 million versus a LIFO charge of
32