Rite Aid 2015 Annual Report Download - page 28
Download and view the complete annual report
Please find page 28 of the 2015 Rite Aid annual report below. You can navigate through the pages in the report by either clicking on the pages listed below, or by using the keyword search tool below to find specific information within the annual report.-
 1
1 -
2
-
3
-
4
-
5
-
6
-
7
-
8
-
9
-
10
-
11
-
12
-
13
-
14
-
15
-
16
-
17
-
 18
18 -
 19
19 -
 20
20 -
 21
21 -
 22
22 -
 23
23 -
 24
24 -
 25
25 -
 26
26 -
 27
27 -
 28
28 -
 29
29 -
 30
30 -
 31
31 -
 32
32 -
 33
33 -
 34
34 -
 35
35 -
 36
36 -
 37
37 -
 38
38 -
39
-
40
-
41
-
42
-
43
-
44
-
45
-
46
-
47
-
48
-
49
-
50
-
51
-
52
-
53
-
54
-
55
-
56
-
57
-
58
-
59
-
60
-
61
-
62
-
63
-
64
-
65
-
66
-
67
-
68
-
69
-
70
-
71
-
72
-
73
-
74
-
75
-
76
-
77
-
78
-
79
-
80
-
81
-
82
-
83
-
84
-
85
-
86
-
87
-
88
-
89
-
90
-
91
-
92
-
93
-
94
-
95
-
96
-
97
-
98
-
99
-
100
-
101
-
102
-
103
-
104
-
105
-
106
-
107
-
108
-
109
-
110
-
111
-
112
-
113
-
114
-
115
-
116
-
117
-
118
-
119
-
120
-
121
-
122
-
123
-
124
-
125
-
126
-
127
-
128
-
129
-
130
-
131
 |
 |

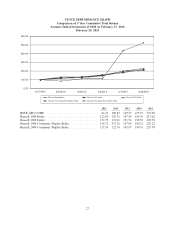
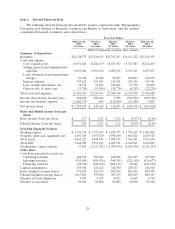
Item 6. Selected Financial Data
The following selected financial data should be read in conjunction with ‘‘Management’s
Discussion and Analysis of Financial Condition and Results of Operations’’ and the audited
consolidated financial statements and related notes.
Fiscal Year Ended
February 28, March 1, March 2, March 3, February 26,
2015 2014 2013 2012 2011
(52 weeks) (52 weeks) (52 weeks) (53 weeks) (52 weeks)
(Dollars in thousands, except per share amounts)
Summary of Operations:
Revenues ..................... $26,528,377 $25,526,413 $25,392,263 $26,121,222 $25,214,907
Costs and expense:
Cost of goods sold ............ 18,951,645 18,202,679 18,073,987 19,327,887 18,522,403
Selling, general and administrative
expenses .................. 6,695,642 6,561,162 6,600,765 6,531,411 6,457,833
Lease termination and impairment
charges ................... 41,945 41,304 70,859 100,053 210,893
Interest expense .............. 397,612 424,591 515,421 529,255 547,581
Loss on debt retirements, net .... 18,512 62,443 140,502 33,576 44,003
Gain on sale of assets, net ....... (3,799) (15,984) (16,776) (8,703) (22,224)
Total costs and expenses .......... 26,101,557 25,276,195 25,384,758 26,513,479 25,760,489
Income (loss) before income taxes . . 426,820 250,218 7,505 (392,257) (545,582)
Income tax (benefit) expense ...... (1,682,353) 804 (110,600) (23,686) 9,842
Net income (loss) ............... $ 2,109,173 $ 249,414 $ 118,105 $ (368,571) $ (555,424)
Basic and diluted income (loss) per
share:
Basic income (loss) per share ...... $ 2.17 $ 0.23 $ 0.12 $ (0.43) $ (0.64)
Diluted income (loss) per share .... $ 2.08 $ 0.23 $ 0.12 $ (0.43) $ (0.64)
Year-End Financial Position:
Working capital ................ $ 1,736,758 $ 1,777,673 $ 1,830,777 $ 1,934,267 $ 1,991,042
Property, plant and equipment, net . . 2,091,369 1,957,329 1,895,650 1,902,021 2,039,383
Total assets ................... 8,863,252 6,944,871 7,078,719 7,364,291 7,555,850
Total debt .................... 5,644,943 5,757,143 6,033,531 6,328,201 6,219,865
Stockholders’ equity (deficit) ...... 57,056 (2,113,702) (2,459,434) (2,586,756) (2,211,367)
Other Data:
Cash flows provided by (used in):
Operating activities ............ 648,959 702,046 819,588 266,537 395,849
Investing activities ............ (593,685) (364,924) (346,305) (221,169) (156,677)
Financing activities ............ (85,781) (320,168) (506,116) 25,801 (251,650)
Capital expenditures ............. 539,386 421,223 382,980 250,137 186,520
Basic weighted average shares ...... 971,102 922,199 889,562 885,819 882,947
Diluted weighted average shares .... 1,017,861 979,092 907,259 885,819 882,947
Number of retail drugstores ....... 4,570 4,587 4,623 4,667 4,714
Number of associates ............ 89,000 89,000 89,000 90,000 91,800
28