Redbox 2009 Annual Report Download - page 49
Download and view the complete annual report
Please find page 49 of the 2009 Redbox annual report below. You can navigate through the pages in the report by either clicking on the pages listed below, or by using the keyword search tool below to find specific information within the annual report.-
 1
1 -
2
-
3
-
4
-
5
-
6
-
7
-
8
-
9
-
10
-
11
-
12
-
13
-
14
-
15
-
16
-
17
-
18
-
19
-
20
-
21
-
22
-
23
-
24
-
25
-
26
-
27
-
28
-
29
-
30
-
31
-
32
-
33
-
34
-
35
-
36
-
37
-
38
-
 39
39 -
 40
40 -
 41
41 -
 42
42 -
 43
43 -
 44
44 -
 45
45 -
 46
46 -
 47
47 -
 48
48 -
 49
49 -
 50
50 -
 51
51 -
 52
52 -
 53
53 -
 54
54 -
 55
55 -
 56
56 -
 57
57 -
 58
58 -
 59
59 -
60
-
61
-
62
-
63
-
64
-
65
-
66
-
67
-
68
-
69
-
70
-
71
-
72
-
73
-
74
-
75
-
76
-
77
-
78
-
79
-
80
-
81
-
82
-
83
-
84
-
85
-
86
-
87
-
88
-
89
-
90
-
91
-
92
-
93
-
94
-
95
-
96
-
97
-
98
-
99
-
100
-
101
-
102
-
103
-
104
-
105
-
106
-
107
-
108
-
109
-
110
 |
 |
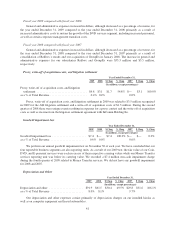
Interest income decreased for the year ended December 31, 2009 due to lower invested balances and a
decrease in interest rates. Lower invested balances and a decrease in interest rates also resulted in lower interest
income in 2008 as compared to 2007.
Interest expense increased in the year ended December 31, 2009 as compared to the year ended
December 31, 2008 primarily due to increased borrowings in 2009 to acquire the remaining 49% interest in
Redbox which has resulted in higher debt balances during the current year periods. Interest expense increased in
2008 from 2007 mainly due to higher debt balances.
Loss (income) from equity investments decreased in 2008 as compared to 2007 primarily as a result of the
consolidation of Redbox’s results beginning in the first quarter of 2008.
Early retirement of debt expense totaled $1.1 million during the year ended December 31, 2009. We used
the proceeds from our convertible debt issuance during the third quarter of 2009 to pay off the $87.5 million term
loan we entered into earlier in 2009. As a result, we wrote off the deferred financing costs of $1.1 million
associated with the term loan. Early retirement of debt expense totaled $1.8 million in 2007 in connection with
the credit facility entered into on November 20, 2007, resulting in a charge of writing off the deferred financing
fee associated with the retirement of our previous credit facility arrangement which commenced in 2004.
Non-controlling interest for the years ended December 31, 2009 and 2008 represents the operating results,
net of income tax, for the 49% stake in Redbox that we did not own prior to our purchase of the remaining
non-controlling interests in Redbox in February 2009.
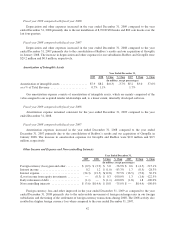
Income Taxes
Our effective income tax rate was 39.3% in 2009 compared with 35.3% in 2008 and 49.2% in 2007. The
effective income tax rate for each of these years varies from the federal statutory tax rate of 35% primarily due to
a change in valuation allowance on foreign net operating losses, state income taxes and non-deductible stock-
based compensation expense recorded for incentive stock option (“ISO”) awards offset by the benefit arising
from ISO disqualifying dispositions.
As of December 31, 2009 and 2008, our net deferred income tax assets (liabilities) totaled $111.5 million
and ($0.9) million, respectively. The increase in the deferred income tax asset was primarily due to a net
operating loss carryforward realized from the sale of our Entertainment Business. In the years ended
December 31, 2009, 2008 and 2007 we recorded tax expense of $19.0 million, $18.3 million, and $22.1 million,
respectively, which, as a result of our U.S. net operating loss carryforwards, will not result in cash payments for
U.S. federal income taxes other than federal alternative minimum taxes. Current tax payments have been made to
state and foreign jurisdictions.
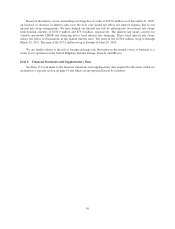
Liquidity and Capital Resources
Cash and Liquidity
A significant portion of our business involves collecting and processing large volumes of cash, most of it in
the form of coins. We present three categories of cash on our balance sheet: cash and cash equivalents, cash in
machine or in transit, and cash being processed.
As of December 31, 2009, we had cash and cash equivalents, cash in machine or in transit, and cash being
processed totaling $192.3 million. This consisted of cash and cash equivalents immediately available to fund our
operations of $61.3 million, cash in machine or in transit of $57.1 million and cash being processed of $73.9
million (which relates to our retailer payable liability as recorded in “accrued payable to retailers and agents” in
the Consolidated Balance Sheet). Working capital was $16.1 million as of December 31, 2009, compared with a
working capital deficit of $(16.3) million as of December 31, 2008. The increase in working capital was
primarily due to the timing of payments to our vendors and retailers.
43