Redbox 2009 Annual Report Download - page 48
Download and view the complete annual report
Please find page 48 of the 2009 Redbox annual report below. You can navigate through the pages in the report by either clicking on the pages listed below, or by using the keyword search tool below to find specific information within the annual report.-
 1
1 -
2
-
3
-
4
-
5
-
6
-
7
-
8
-
9
-
10
-
11
-
12
-
13
-
14
-
15
-
16
-
17
-
18
-
19
-
20
-
21
-
22
-
23
-
24
-
25
-
26
-
27
-
28
-
29
-
30
-
31
-
32
-
33
-
34
-
35
-
36
-
37
-
 38
38 -
 39
39 -
 40
40 -
 41
41 -
 42
42 -
 43
43 -
 44
44 -
 45
45 -
 46
46 -
 47
47 -
 48
48 -
 49
49 -
 50
50 -
 51
51 -
 52
52 -
 53
53 -
 54
54 -
 55
55 -
 56
56 -
 57
57 -
 58
58 -
59
-
60
-
61
-
62
-
63
-
64
-
65
-
66
-
67
-
68
-
69
-
70
-
71
-
72
-
73
-
74
-
75
-
76
-
77
-
78
-
79
-
80
-
81
-
82
-
83
-
84
-
85
-
86
-
87
-
88
-
89
-
90
-
91
-
92
-
93
-
94
-
95
-
96
-
97
-
98
-
99
-
100
-
101
-
102
-
103
-
104
-
105
-
106
-
107
-
108
-
109
-
110
 |
 |

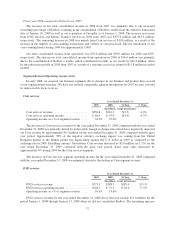
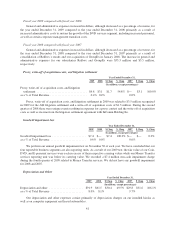
Fiscal year 2009 compared with fiscal year 2008
Depreciation and other expenses increased in the year ended December 31, 2009 compared to the year
ended December 31, 2008 primarily due to the net installation of 8,700 DVD kiosks and 800 coin kiosks over the
last four quarters.
Fiscal year 2008 compared with fiscal year 2007
Depreciation and other expenses increased in the year ended December 31, 2008 compared to the year
ended December 31, 2007 primarily due to the consolidation of Redbox’s results and our acquisition of GroupEx
in January 2008. The increase in depreciation and other expenses for our subsidiaries Redbox and GroupEx were
$29.2 million and $0.9 million, respectively.
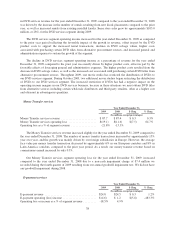
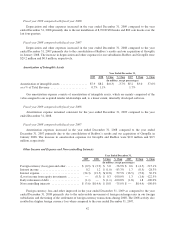
Amortization of Intangible Assets
Year Ended December 31,
2009 2008 $ Chng % Chng 2007 $ Chng % Chng
(In millions, except percentages)
Amortization of intangible assets .................. $7.9 $8.2 $(0.3) -3.7% $5.2 $3.0 57.6%
as a % of Total Revenue ......................... 0.7% 1.1% 1.7%
Our amortization expense consists of amortization of intangible assets, which are mainly comprised of the
value assigned to our acquired retailer relationships and, to a lesser extent, internally developed software.
Fiscal year 2009 compared with fiscal year 2008
Amortization expense remained consistent for the year ended December 31, 2009 compared to the year
ended December 31, 2008.
Fiscal year 2008 compared with fiscal year 2007
Amortization expenses increased in the year ended December 31, 2008 compared to the year ended
December 31, 2007 primarily due to the consolidation of Redbox’s results and our acquisition of GroupEx in
January 2008. The increase in amortization expenses for GroupEx and Redbox were $2.0 million and $0.5
million, respectively.
Other Income and Expense and Non-controlling Interests
Year Ended December 31,
2009 2008 $ Chng % Chng 2007 $ Chng % Chng
(In millions, except percentages)
Foreign currency (loss) gain and other ......... $ (0.9) $ (3.9) $ 3.0 -76.9% $ 0.6 $ (4.5) -715.1%
Interest income ........................... 0.2 1.2 $ (1.0) -83.3% 1.7 (0.5) -28.3%
Interest expense .......................... (34.3) (21.5) $(12.8) 59.5% (16.5) (5.0) 30.3%
(Loss) income from equity investments ........ — (0.3) $ 0.3 -100.0% 1.3 (1.6) -122.5%
Early retirement of debt .................... (1.1) — $ (1.1) -100.0% (1.8) 1.8 -100.0%
Non-controlling interests ................... $ (3.6) $(14.4) $ 10.8 -75.0% $ — $(14.4) -100.0%
Foreign currency loss and other improved in the year ended December 31, 2009 as compared to the year
ended December 31, 2008 primarily due to the unfavorable movement of foreign exchange rates in our foreign
subsidiaries and the timing of the settlement of foreign currency transactions during 2008. The 2008 activity also
resulted in a higher foreign currency loss when compared to the year ended December 31, 2007.
42