Redbox 2009 Annual Report Download - page 32
Download and view the complete annual report
Please find page 32 of the 2009 Redbox annual report below. You can navigate through the pages in the report by either clicking on the pages listed below, or by using the keyword search tool below to find specific information within the annual report.-
 1
1 -
2
-
3
-
4
-
5
-
6
-
7
-
8
-
9
-
10
-
11
-
12
-
13
-
14
-
15
-
16
-
17
-
18
-
19
-
20
-
21
-
 22
22 -
 23
23 -
 24
24 -
 25
25 -
 26
26 -
 27
27 -
 28
28 -
 29
29 -
 30
30 -
 31
31 -
 32
32 -
 33
33 -
 34
34 -
 35
35 -
 36
36 -
 37
37 -
 38
38 -
 39
39 -
 40
40 -
 41
41 -
 42
42 -
43
-
44
-
45
-
46
-
47
-
48
-
49
-
50
-
51
-
52
-
53
-
54
-
55
-
56
-
57
-
58
-
59
-
60
-
61
-
62
-
63
-
64
-
65
-
66
-
67
-
68
-
69
-
70
-
71
-
72
-
73
-
74
-
75
-
76
-
77
-
78
-
79
-
80
-
81
-
82
-
83
-
84
-
85
-
86
-
87
-
88
-
89
-
90
-
91
-
92
-
93
-
94
-
95
-
96
-
97
-
98
-
99
-
100
-
101
-
102
-
103
-
104
-
105
-
106
-
107
-
108
-
109
-
110
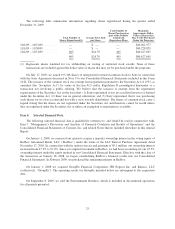
 |
 |

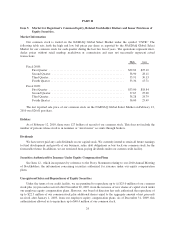
Year Ended December 31,
2009 2008 2007 2006 2005
(in thousands, except per share data)
CONSOLIDATED STATEMENT OF
OPERATIONS:
REVENUE .................................... $1,144,791 $ 761,681 $307,385 $260,952 $220,675
EXPENSES:
Direct operating ............................ 793,444 494,311 153,692 142,752 113,639
Marketing ................................. 22,757 19,197 11,503 14,111 10,604
Research and development .................... 5,312 4,758 5,153 5,246 5,716
General and administrative ................... 127,033 94,292 42,442 33,764 22,094
Depreciation and other ....................... 91,858 61,469 29,820 27,535 26,827
Amortization of intangible assets ............... 7,912 8,206 5,208 4,078 2,738
Proxy, write-off of acquisition costs, and litigation
settlement ............................... 4,762 3,084 — — —
Goodwill impairment loss .................... 7,371 ————
Income from operations .................. 84,342 76,364 59,567 33,466 39,057
OTHER INCOME (EXPENSE):
Foreign currency (loss) gain and other, net ....... (924) (3,928) 634 113 189
Interest income ............................. 208 1,218 1,674 1,343 1,247
Interest expense ............................ (34,331) (21,526) (16,500) (15,306) (12,905)
(Loss) income from equity investments and
other ................................... — (337) 1,333 (66) 353
Early retirement of debt ...................... (1,082) — (1,794) (238) —
Income from continuing operations before
income taxes ......................... 48,213 51,791 44,914 19,312 27,941
Income tax expense ......................... (18,950) (18,290) (22,118) (7,542) (10,770)
Income from continuing operations ................. 29,263 33,501 22,796 11,770 17,171
Income (loss) from discontinued operations, net of
tax ......................................... 28,007 (4,953) (45,049) 6,857 5,101
Net income (loss) ............................... 57,270 28,548 (22,253) 18,627 22,272
Less: Net income attributable to non-controlling
interests ................................. (3,627) (14,436) — — —
NET INCOME (LOSS) ATTRIBUTABLE TO
COINSTAR, INC ............................. $ 53,643 $ 14,112 $ (22,253) $ 18,627 $ 22,272
NET INCOME (LOSS) PER SHARE
ATTRIBUTABLE TO COINSTAR, INC.:
Basic(1) .................................. $ 1.78 $ 0.50 $ (0.80) $ 0.67 $ 0.86
Diluted(1) ................................. $ 1.76 $ 0.50 $ (0.80) $ 0.66 $ 0.86
CONSOLIDATED BALANCE SHEET DATA:
Cash and cash equivalents .................... $ 61,280 $ 66,408 $ 21,397 $ 18,687 $ 45,365
Cash in machine or in transit(2) ................ 57,141 34,583 87,858 63,740 60,070
Cash being processed(3) ...................... 73,875 91,044 87,337 95,737 69,832
Total assets ................................ 1,222,799 1,066,714 768,573 718,083 643,401
Total debt, capital lease obligations and other ..... 468,957 351,370 272,651 200,264 210,478
Common stock ............................. 406,333 369,735 354,509 343,229 328,951
Total stockholders’ equity .................... 412,391 320,028 305,130 321,365 294,047
(1) See Note 13 to Consolidated Financial Statements for an explanation of the determination of the number of
shares used in computing net income per share information, basic and diluted.
(2) Cash in machine or in transit is unavailable for immediate cash requirements as it represents cash being
processed by carriers, cash deposits in transit, or cash residing in our coin-counting machines or, prior to
September 8, 2009, our entertainment services machines.
(3) Cash being processed represents cash residing in our coin-counting machines or, prior to September 8, 2009,
our entertainment services machines or being processed by carriers, which we are specifically obligated to
use to settle our accrued payable to retailers.
26