Red Lobster 2010 Annual Report Download - page 66
Download and view the complete annual report
Please find page 66 of the 2010 Red Lobster annual report below. You can navigate through the pages in the report by either clicking on the pages listed below, or by using the keyword search tool below to find specific information within the annual report.-
 1
1 -
2
-
3
-
4
-
5
-
6
-
7
-
8
-
9
-
10
-
11
-
12
-
13
-
14
-
15
-
16
-
17
-
18
-
19
-
20
-
21
-
22
-
23
-
24
-
25
-
26
-
27
-
28
-
29
-
30
-
31
-
32
-
33
-
34
-
35
-
36
-
37
-
38
-
39
-
40
-
41
-
42
-
43
-
44
-
45
-
46
-
47
-
48
-
49
-
50
-
51
-
52
-
53
-
54
-
55
-
 56
56 -
 57
57 -
 58
58 -
 59
59 -
 60
60 -
 61
61 -
 62
62 -
 63
63 -
 64
64 -
 65
65 -
 66
66 -
 67
67 -
 68
68 -
 69
69 -
 70
70 -
 71
71 -
 72
72
 |
 |

The Director Compensation Program was amended, effective September 1,
2008, to eliminate payment of meeting fees for regular Board meetings, as
well as the initial and annual grant of stock options. As of September 1, 2008,
our Director Compensation Program provides for payments to non-employee
directors of: (a) an annual retainer and meeting fees for special Board meetings
andcommitteemeetings;(b)anadditionalannualretainerforcommittee
chairs;and(c)anannualawardofcommonstockwithafairvalueof
$0.1 million on the date of grant.
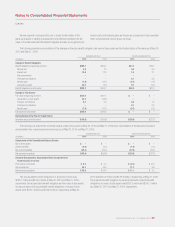
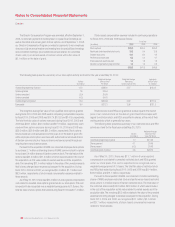
Stock-based compensation expense included in continuing operations
for fiscal 2010, 2009 and 2008 was as follows:
Fiscal Year
(in millions) 2010 2009 2008
Stock options $20.2 $20.4 $25.2
Restricted stock/restricted stock units 10.2 9.4 12.9
Darden stock units 13.1 8.4 4.2
Performance stock units 6.8 0.4 4.1
Employee stock purchase plan 1.8 1.6 1.6
Director compensation program/other 1.4 1.3 0.9
$53.5 $41.5 $48.9
64 DARDEN RESTAURANTS, INC. | 2010 ANNUAL REPORT
Notes to Consolidated Financial Statements
Darden
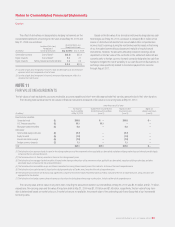
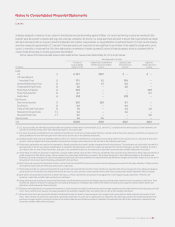
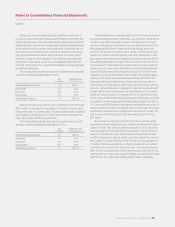
The following table presents a summary of our stock option activity as of and for the year ended May 30, 2010:
Weighted-Average Weighted-Average Aggregate
Options Exercise Price Remaining Intrinsic Value
(in millions) Per Share Contractual Life (Yrs) (in millions)
Outstanding beginning of period 15.2 $28.30 5.57 $130.2
Options granted 1.8 32.64
Options exercised (2.9) 20.58
Options canceled (0.2) 34.42
Outstanding end of period 13.9 $30.38 5.62 $173.9
Exercisable 8.4 $27.21 3.98 $131.2
The weighted-average fair value of non-qualified stock options granted
during fiscal 2010, 2009 and 2008 used in computing compensation expense
for fiscal 2010, 2009 and 2008 was $10.74, $10.52 and $14.05, respectively.
The total intrinsic value of options exercised during fiscal 2010, 2009 and
2008 was $59.1 million, $56.4 million and $57.9 million, respectively. Cash
received from option exercises during fiscal 2010, 2009 and 2008 was
$59.3 million, $50.8 million and $61.5 million, respectively. Stock options
have a maximum contractual period of ten years from the date of grant. We
settle employee stock option exercises with authorized but unissued shares
of Darden common stock or treasury shares we have acquired through our
ongoing share repurchase program.
Pursuant to the acquisition of RARE, we converted employee stock options
to purchase 2.7 million outstanding shares of RARE common stock to options
to purchase 2.4 million shares of Darden common stock. The total value of the
options was $42.9 million, $31.9 million of which was included in the cost of
the acquisition, as this value related to vested awards as of the acquisition
date. The remaining $11.0 million relates to the value of the unvested awards
that is being charged as an expense subsequent to the acquisition. During
fiscal 2010, 2009 and 2008, we recognized $0.4 million, $1.3 million and
$9.3 million, respectively, of stock-based compensation expense related to
these awards.
As of May 30, 2010, there was $30.4 million of unrecognized compensation
cost related to unvested stock options granted under our stock plans. This cost
is expected to be recognized over a weighted-average period of 1.8 years. The
total fair value of stock options that vested during fiscal 2010 was $17.4 million.
Restricted stock and RSUs are granted at a value equal to the market
price of our common stock on the date of grant. Restrictions lapse with
regard to restricted stock, and RSUs are settled in shares, at the end of their
vesting periods, which is generally four years.
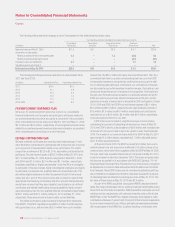
The following table presents a summary of our restricted stock and RSU
activity as of and for the fiscal year ended May 30, 2010:
Weighted-Average
Shares Grant Date Fair
(in millions) Value Per Share
Outstanding beginning of period 1.0 $31.36
Shares granted 0.1 35.06
Shares vested (0.3) 29.03
Outstanding end of period 0.8 $28.73
As of May 30, 2010, there was $11.7 million of unrecognized
compensation cost related to unvested restricted stock and RSUs granted
under our stock plans. This cost is expected to be recognized over a
weighted-average period of 2.4 years. The total fair value of restricted stock
and RSUs that vested during fiscal 2010, 2009 and 2008 was $9.4 million,
$16.8 million and $13.1 million, respectively.
Pursuant to the acquisition of RARE, we converted 0.5 million outstanding
shares of RARE employee restricted stock and performance-based restricted
stock units to 0.4 million shares of Darden restricted stock. The total value of
the restricted shares was $16.8 million, $8.6 million of which was included
in the cost of the acquisition as this value related to vested awards as of the
acquisition date. The remaining $8.2 million relates to the value of the unvested
awards and is being charged to expense subsequent to the acquisition. During
fiscal 2010, 2009 and 2008, we recognized $2.1 million, $2.1 million
and $3.7 million, respectively, of stock-based compensation expense
related to these awards.