Red Lobster 2010 Annual Report Download - page 56
Download and view the complete annual report
Please find page 56 of the 2010 Red Lobster annual report below. You can navigate through the pages in the report by either clicking on the pages listed below, or by using the keyword search tool below to find specific information within the annual report.-
 1
1 -
2
-
3
-
4
-
5
-
6
-
7
-
8
-
9
-
10
-
11
-
12
-
13
-
14
-
15
-
16
-
17
-
18
-
19
-
20
-
21
-
22
-
23
-
24
-
25
-
26
-
27
-
28
-
29
-
30
-
31
-
32
-
33
-
34
-
35
-
36
-
37
-
38
-
39
-
40
-
41
-
42
-
43
-
44
-
45
-
 46
46 -
 47
47 -
 48
48 -
 49
49 -
 50
50 -
 51
51 -
 52
52 -
 53
53 -
 54
54 -
 55
55 -
 56
56 -
 57
57 -
 58
58 -
 59
59 -
 60
60 -
 61
61 -
 62
62 -
 63
63 -
 64
64 -
 65
65 -
 66
66 -
67
-
68
-
69
-
70
-
71
-
72
 |
 |

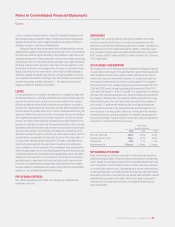
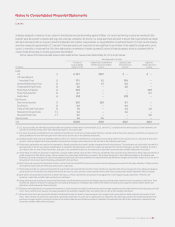
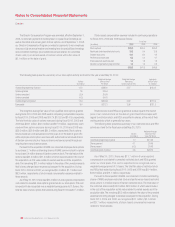
The fair value of our derivative instruments as of May 30, 2010 and May 31, 2009, is as follows:
Balance Derivative Assets Derivative Liabilities
Sheet
(in millions) Location May 30, 2010 May 31, 2009 May 30, 2010 May 31, 2009
Derivative contracts designated as hedging instruments
Commodity contracts (1) $ – $ – $ (0.6) $(2.4)
Equity forwards (1) – 0.4 (0.4)–
Interest rate related (1) 3.4 – (10.5) (2.8)
Foreign currency forwards (1) 1.1 0.8 – –
$4.5 $1.2 $(11.5) $(5.2)
Derivative contracts not designated as hedging instruments
Commodity contracts (1) $ – $ – $ – $(0.8)
Equity forwards (1) – 1.0 (0.6)–
$ – $1.0 $ (0.6) $(0.8)
Total derivative contracts $4.5 $2.2 $(12.1) $(6.0)
(1) Derivative assets and liabilities are included in Prepaid Expenses and Other Current Assets and Other Current Liabilities, respectively, on our consolidated balance sheets.
The effect of derivative instruments in cash flow hedging relationships on the consolidated statements of earnings for the years ended May 30, 2010 and
May 31, 2009, are as follows:
(1)
Amount of Gain (Loss) Location of Gain (Loss) Amount of Gain (Loss) Location of Gain (Loss) Amount of Gain (Loss)
Recognized in AOCI Reclassified from AOCI Reclassified from AOCI Recognized in Income Recognized in Income
(in millions) (Effective Portion) to Income to Income (Effective Portion) (Ineffective Portion) (Ineffective Portion)
2010 2009 2010 2009 2010 2009
Commodity contracts $(2.1) $ (8.7) Cost of Sales(2) $(3.8) $(6.1) Cost of Sales(2) $ – $–
Cost of Sales Cost of Sales
Equity forwards 3.9 1.2 and SG&A(3) – – andSG&A(3) 0.3–
Interest rate (7.7) (6.9) Interest, net 0.5 (1.3) Interest, net ––
Cost of Sales Cost of Sales
Foreign currency forwards 1.3 0.8 and SG&A(4) 1.1 – andSG&A(4) ––
$(4.6) $(13.6) $(2.2) $(7.4) $0.3 $–
(1) Generally, all of our derivative instruments designated as cash flow hedges have some level of ineffectiveness, which is recognized currently in earnings. However, as these amounts are
generally nominal and our consolidated financial statements are presented “in millions,” these amounts will generally appear as zero in this tabular presentation.
(2) Location of gain (loss) reclassified from AOCI to income as well as the gain (loss) recognized in income for the ineffective portion of the hedge is food and beverage costs and restaurant
expenses, which are components of cost of sales.
(3) Location of gain (loss) reclassified from AOCI to income as well as the gain (loss) recognized in income for the ineffective portion of the hedge is restaurant labor expenses, which is a
component of cost of sales, and selling, general and administrative expenses.
(4) Location of gain (loss) reclassified from AOCI to income as well as the gain (loss) recognized in income for the ineffective portion of the hedge is food and beverage costs, which is a
component of cost of sales, and selling, general and administrative expenses.
The effects of derivative instruments in fair value hedging relationships on the consolidated statements of earnings for the years ended May 30, 2010 and
May 31, 2009, are as follows:
(in millions)
Amount of Gain (Loss) Location of Gain (Loss) Amount of Gain (Loss) Location of Gain (Loss)
Derivatives in Fair Value Recognized in Income Recognized in Income Hedged Item in Fair Value Recognized in Income Recognized in Income
Hedging Relationships on Derivatives on Derivatives Hedge Relationship on Related Hedged Item on Related Hedged Item
Year Ended Year Ended
May 30, 2010 May 31, 2009 May 30, 2010 May 31, 2009
Interest rate $3.4 – Interest,net Fixed-ratedebt $(3.4) – Interest,net
$3.4 – $(3.4) –
54 DARDEN RESTAURANTS, INC. | 2010 ANNUAL REPORT
Notes to Consolidated Financial Statements
Darden