Red Lobster 2010 Annual Report Download - page 61
Download and view the complete annual report
Please find page 61 of the 2010 Red Lobster annual report below. You can navigate through the pages in the report by either clicking on the pages listed below, or by using the keyword search tool below to find specific information within the annual report.-
 1
1 -
2
-
3
-
4
-
5
-
6
-
7
-
8
-
9
-
10
-
11
-
12
-
13
-
14
-
15
-
16
-
17
-
18
-
19
-
20
-
21
-
22
-
23
-
24
-
25
-
26
-
27
-
28
-
29
-
30
-
31
-
32
-
33
-
34
-
35
-
36
-
37
-
38
-
39
-
40
-
41
-
42
-
43
-
44
-
45
-
46
-
47
-
48
-
49
-
50
-
 51
51 -
 52
52 -
 53
53 -
 54
54 -
 55
55 -
 56
56 -
 57
57 -
 58
58 -
 59
59 -
 60
60 -
 61
61 -
 62
62 -
 63
63 -
 64
64 -
 65
65 -
 66
66 -
 67
67 -
 68
68 -
 69
69 -
 70
70 -
 71
71 -
72
 |
 |

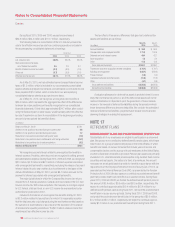
We are required to recognize the over or under-funded status of the
plans as an asset or liability as measured by the difference between the fair
value of the plan assets and the benefit obligation and any unrecognized prior
service costs and actuarial gains and losses as a component of accumulated
other comprehensive income (loss), net of tax.
DARDEN RESTAURANTS, INC. | 2010 ANNUAL REPORT 59
Notes to Consolidated Financial Statements
Darden
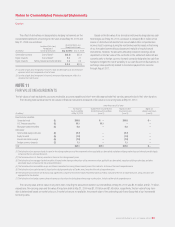
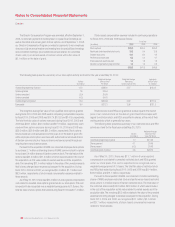
The following provides a reconciliation of the changes in the plan benefit obligation, fair value of plan assets and the funded status of the plans as of May 30,
2010 and May 31, 2009:
Defined Benefit Plans Postretirement Benefit Plan
(in millions) 2010 2009 2010 2009
Change in Benefit Obligation:
Benefit obligation at beginning of period $169.7 $169.7 $27.3 $25.7
Service cost 4.9 7.5 0.6 0.9
Interest cost 10.0 12.3 1.9 2.1
Plan amendments – – ––
Participant contributions – – 0.1 0.3
Benefits paid (7.9) (10.1) (0.7) (1.5)
Actuarial loss (gain) 23.5 (9.7) 9.7 (0.2)
Benefit obligation at end of period $200.2 $169.7 $38.9 $27.3
Change in Plan Assets:
Fair value at beginning of period $139.9 $191.7 $ – $–
Actual return on plan assets 22.2 (42.2) ––
Employer contributions 0.4 0.5 0.6 1.2
Participant contributions – – 0.1 0.3
Benefits paid (7.9) (10.1) (0.7) (1.5)
Fair value at end of period $154.6 $139.9 $ – $–
Reconciliation of the Plan’s Funded Status:
Unfunded status at end of period $ (45.6) $ (29.8) $(38.9) $(27.3)
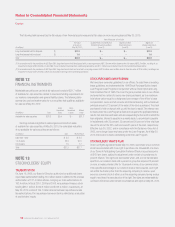
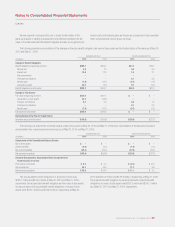
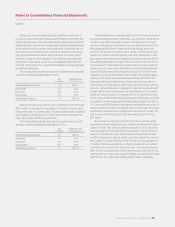
The following is a detail of the net funded status of each of our plans of May 30, 2010 and May 31, 2009 and a reconciliation of the amounts included in
accumulated other comprehensive income (loss) as of May 30, 2010 and May 31, 2009:
Defined Benefit Plans Postretirement Benefit Plan
(in millions) 2010 2009 2010 2009
Components of the Consolidated Balance Sheets:
Non-current assets $ – $ – $ – $–
Current liabilities (0.4) (0.4) (1.0) (1.0)
Non-current liabilities (45.2) (29.4) (37.9) (26.3)
Net amounts recognized $(45.6) $(29.8) $(38.9) $(27.3)
Amounts Recognized in Accumulated Other Comprehensive
Income (Loss), net of tax:
Prior service cost (credit) $ 0.3 $ 0.4 $ (0.1) $ (0.1)
Net actuarial loss 55.3 44.5 11.2 5.6
Net amounts recognized $ 55.6 $ 44.9 $ 11.1 $ 5.5
The accumulated benefit obligation for all pension plans was
$196.7 million and $164.0 million at May 30, 2010 and May 31, 2009,
respectively. The accumulated benefit obligation and fair value of plan assets
for pension plans with accumulated benefit obligations in excess of plan
assets were $196.7 million and $154.6 million, respectively, at May 30,
2010 and $164.0 million and $139.9 million, respectively, at May 31, 2009.
The projected benefit obligation for pension plans with projected benefit
obligations in excess of plan assets was $200.2 million and $169.7 million
as of May 30, 2010 and May 31, 2009, respectively.