Red Lobster 2010 Annual Report Download - page 26
Download and view the complete annual report
Please find page 26 of the 2010 Red Lobster annual report below. You can navigate through the pages in the report by either clicking on the pages listed below, or by using the keyword search tool below to find specific information within the annual report.-
 1
1 -
2
-
3
-
4
-
5
-
6
-
7
-
8
-
9
-
10
-
11
-
12
-
13
-
14
-
15
-
 16
16 -
 17
17 -
 18
18 -
 19
19 -
 20
20 -
 21
21 -
 22
22 -
 23
23 -
 24
24 -
 25
25 -
 26
26 -
 27
27 -
 28
28 -
 29
29 -
 30
30 -
 31
31 -
 32
32 -
 33
33 -
 34
34 -
 35
35 -
 36
36 -
37
-
38
-
39
-
40
-
41
-
42
-
43
-
44
-
45
-
46
-
47
-
48
-
49
-
50
-
51
-
52
-
53
-
54
-
55
-
56
-
57
-
58
-
59
-
60
-
61
-
62
-
63
-
64
-
65
-
66
-
67
-
68
-
69
-
70
-
71
-
72
 |
 |

24 DARDEN RESTAURANTS, INC. | 2010 ANNUAL REPORT
Notes to Consolidated Financial Statements
Darden Restaurants
24 DARDEN RESTAURANTS, INC. | 2010 ANNUAL REPORT
Management’s Discussion and Analysis
of Financial Condition and Results of Operations
Darden
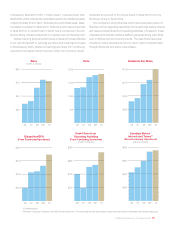
sales for LongHorn Steakhouse decreased 1.9 percent due to a 4.2 percent
decrease in same-restaurant guest counts, partially offset by a 2.3 percent
increase in average guest check. Average annual sales per restaurant for
LongHorn Steakhouse were $2.7 million in fiscal 2010 compared to
$2.8 million in fiscal 2009 (52-week basis).
The Capital Grille sales of $241.8 million in fiscal 2010 were 3.2 percent
above last year. The Capital Grille opened three new restaurants during fiscal
2010. On a 52-week basis, annual same-restaurant sales for The Capital Grille
decreased 7.8 percent due to a 5.9 percent decrease in same-restaurant
guest counts combined with a 1.9 percent decrease in average guest check.
Average annual sales per restaurant for The Capital Grille were $6.2 million in
fiscal 2010 compared to $6.8 million in fiscal 2009 (52-week basis).
Bahama Breeze sales of $130.0 million in fiscal 2010 were 1.0 percent
below last year. Bahama Breeze opened one new restaurant during fiscal 2010.
When compared to a 52-week basis for fiscal 2009, annual same-restaurant
sales for Bahama Breeze decreased 2.9 percent due to a 2.0 percent decrease
in same-restaurant guest counts combined with a 0.9 percent decrease
in average guest check. Average annual sales per restaurant for Bahama
Breeze were $5.4 million in fiscal 2010 compared to $5.5 million in fiscal
2009 (52-week basis).
The 8.9 percent increase in Company-wide sales for fiscal 2009 versus
fiscal 2008 was primarily due to the contribution of LongHorn Steakhouse and
The Capital Grille for the entire fiscal year, a net increase of 38 Olive Gardens,
16 net new LongHorn Steakhouses, 10 net new Red Lobsters and 5 new
The Capital Grilles in fiscal 2009, the impact of the 53rd week and U.S.
same-restaurant sales increases at Olive Garden. Olive Garden’s fiscal 2009
sales of $3.29 billion were 7.2 percent above fiscal 2008 sales. On a 52-week
basis, annual U.S. same-restaurant sales for Olive Garden increased 0.3 per-
cent in fiscal 2009 due to a 2.6 percent increase in average guest check,
partially offset by a 2.3 percent decrease in same-restaurant guest counts.
Average annual sales per restaurant for Olive Garden were $4.8 million in
fiscal 2009 (52-week basis) compared to $4.9 million in fiscal 2008. Red
Lobster’s sales of $2.62 billion in fiscal 2009 were 0.2 percent below fiscal
2008 sales. On a 52-week basis, annual U.S. same-restaurant sales for Red
Lobster decreased 2.2 percent due to a 5.1 percent decrease in same-
restaurant guest counts, partially offset by a 2.9 percent increase in average
check. Average annual sales per restaurant for Red Lobster were $3.8 million
in fiscal 2009 (52-week basis) compared to $3.9 million in fiscal 2008.
LongHorn Steakhouse’s fiscal 2009 sales of $888.4 million were 3.6 percent
above the comparable prior year period (which were included in RARE’s
separately reported results of operations), driven by sales from 16 net new
restaurants, partially offset by a same-restaurant sales decrease. On a
52-week basis, annual same-restaurant sales for LongHorn Steakhouse
decreased 5.6 percent due to a 7.3 percent decrease in same-restaurant
guest counts, partially offset by a 1.7 percent increase in average guest check.
Average annual sales per restaurant for LongHorn Steakhouse were
$2.8 million in fiscal 2009 compared to $2.9 million in fiscal 2008. The
Capital Grille’s fiscal 2009 sales of $234.4 million were 3.3 percent below
the comparable prior year period (which were included in RARE’s separately
reported results of operations), driven by a same-restaurant sales decrease
partially offset by sales from five new restaurants. On a 52-week basis, annual
same-restaurant sales for The Capital Grille decreased 15.5 percent due to
a 16.3 percent decrease in same-restaurant guest counts, partially offset
by a 0.8 percent increase in average guest check. Average annual sales per
restaurant for The Capital Grille were $6.8 million in fiscal 2009 (52-week
basis) compared to $8.1 million in fiscal 2008. Bahama Breeze’s fiscal 2009
sales from continuing operations of $131.4 million decreased 2.9 percent
from fiscal 2008. On a 52-week basis, annual same-restaurant sales for
Bahama Breeze decreased 6.0 percent due to a 7.8 percent decrease in
same-restaurant guest counts, partially offset by a 1.8 percent increase
in average guest check. Average annual sales per restaurant for Bahama
Breeze were $5.5 million in fiscal 2009 (52-week basis) compared to
$5.9 million in fiscal 2008.
COSTS AND EXPENSES
Total costs and expenses from continuing operations were $6.57 billion in
fiscal 2010, $6.70 billion in fiscal 2009 and $6.11 billion in fiscal 2008. As a
percent of sales, total costs and expenses from continuing operations in fiscal
2010 were 92.4 percent, which decreased from 92.9 percent in fiscal 2009
and increased from 92.2 percent in fiscal 2008.
Food and beverage costs decreased $149.1 million, or 6.8 percent, from
$2.20 billion in fiscal 2009 to $2.05 billion in fiscal 2010. Food and beverage
costs increased $204.1 million, or 10.2 percent, from $2.00 billion in fiscal
2008 to $2.20 billion in fiscal 2009. As a percent of sales, food and beverage
costs decreased from fiscal 2009 to fiscal 2010 primarily as a result of lower
seafood, beef and commodity costs and pricing. As a percent of sales, food
and beverage costs increased from fiscal 2008 to fiscal 2009 primarily as a
result of the acquisition of RARE, whose brands have historically had higher
food and beverage costs, as a percent of sales, compared to our consolidated
average prior to the acquisition, as well as increases in food costs, such as
dairy, wheat and pork, which were partially offset by pricing increases and
decreases in seafood costs.
Restaurant labor costs increased $42.4 million, or 1.8 percent, from
$2.31 billion in fiscal 2009 to $2.35 billion in fiscal 2010. Restaurant labor
costs increased $183.5 million, or 8.6 percent, from $2.12 billion in fiscal
2008 to $2.31 billion in fiscal 2009. As a percent of sales, restaurant labor
costs increased in fiscal 2010 primarily as a result of an increase in wage
rates, manager compensation, employee medical costs and the impact of
sales deleveraging partially offset by productivity gains and reduced turnover.
As a percent of sales, restaurant labor costs decreased in fiscal 2009 from
fiscal 2008 primarily as a result of the acquisition of RARE, whose brands
have historically had lower restaurant labor costs, as a percent of sales,
compared to our consolidated average prior to the acquisition, as well
as pricing and lower employee medical costs. As a percent of sales, this
decrease in restaurant labor costs was partially offset by an increase in
wage rates and manager compensation.
Restaurant expenses (which include lease, property tax, credit card, utility,
workers’ compensation, insurance, new restaurant pre-opening and other
restaurant-level operating expenses) decreased $46.2 million, or 4.1 percent,
from $1.13 billion in fiscal 2009 to $1.08 billion in fiscal 2010. Restaurant
expenses increased $110.6 million, or 10.9 percent, from $1.02 billion in fiscal
2008 to $1.13 billion in fiscal 2009. As a percent of sales, restaurant expenses
decreased in fiscal 2010 as compared to fiscal 2009 primarily as a result of
lower utility costs and repair and maintenance expenses, which were partially
offset by the impact of sales deleveraging. As a percent of sales, restaurant
expenses increased in fiscal 2009 as compared to fiscal 2008 primarily as a
result of higher utility costs, RARE’s higher restaurant expenses as a percent
of sales compared to our consolidated average prior to the acquisition and