Red Lobster 2010 Annual Report Download - page 17
Download and view the complete annual report
Please find page 17 of the 2010 Red Lobster annual report below. You can navigate through the pages in the report by either clicking on the pages listed below, or by using the keyword search tool below to find specific information within the annual report.-
 1
1 -
2
-
3
-
4
-
5
-
6
-
 7
7 -
 8
8 -
 9
9 -
 10
10 -
 11
11 -
 12
12 -
 13
13 -
 14
14 -
 15
15 -
 16
16 -
 17
17 -
 18
18 -
 19
19 -
 20
20 -
 21
21 -
 22
22 -
 23
23 -
 24
24 -
 25
25 -
 26
26 -
 27
27 -
28
-
29
-
30
-
31
-
32
-
33
-
34
-
35
-
36
-
37
-
38
-
39
-
40
-
41
-
42
-
43
-
44
-
45
-
46
-
47
-
48
-
49
-
50
-
51
-
52
-
53
-
54
-
55
-
56
-
57
-
58
-
59
-
60
-
61
-
62
-
63
-
64
-
65
-
66
-
67
-
68
-
69
-
70
-
71
-
72
 |
 |
DARDEN RESTAURANTS, INC. | 2010 ANNUAL REPORT 15
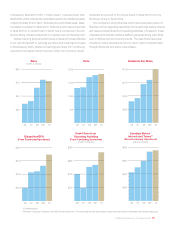
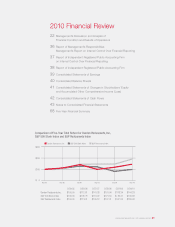
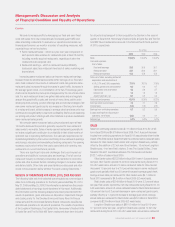
Totalsalesinscal2010of$7.11billionwere1.4percentlowerthan
fiscal 2009, which included an extra fiscal week that contributed sales
ofapproximately$124million.Excludingtheextrascalweek,sales
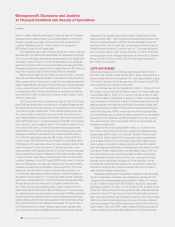
increased 0.3 percent in fiscal 2010. Total unit growth was 2.9 percent
in fiscal 2010 in an environment in which many companies in the full-
service dining industry postponed or reduced new unit development.
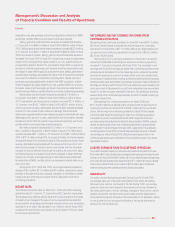
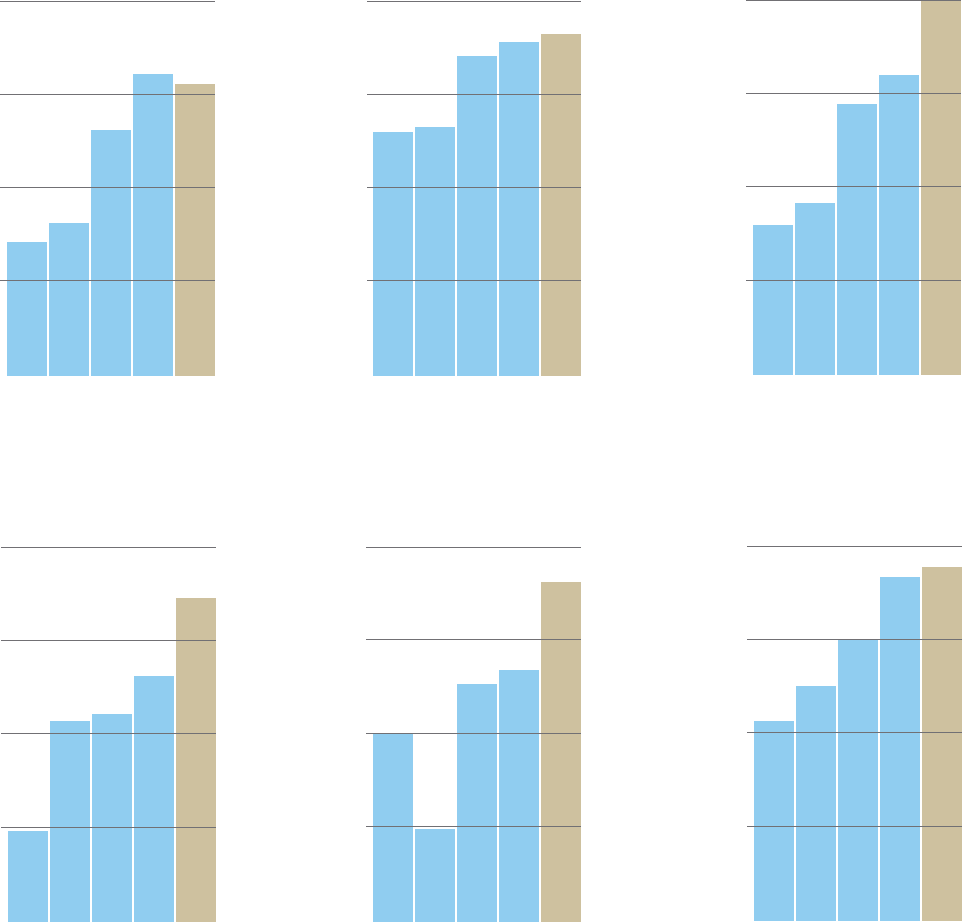
Darden’sstrongnancialperformanceinscal2010wasreected
in our reported growth in earnings per share and meaningful increase
in dividends per share. Diluted net earnings per share from continuing
operationsincreasednearly8percentwhiletheCompanyraised
dividends25percentto$1.00pershareinscal2010fromthe
$0.80pershareinscal2009.
The Company’s strong financial performance was also evident in
financial metrics regarding operating income (earnings before interest
andtaxesandcashowsfromoperatingactivities).Increasesinthese
measuresdemonstrateDarden’sabilitytogeneratestrongcashows
evenindifculteconomicenvironments.Thecashowshavebeen
invested in future development and to return cash to shareholders
through dividends and share repurchases.
Sales
(dollars in billions)
06 07 08 09* 10
$5.0
$6.0
$7.0
$8.0
Units
06 07 08 09* 10
500
1,000
1,500
2,000
Dividends Per Share
06 07 08 09* 10
$0.25
$0.50
$0.75
$1.00
Diluted Net EPS
(From Continuing Operations)
06 07 08 09* 10
$2.25
$2.50
$2.75
$3.00
Cash Flows from
Operating Activities
(From Continuing Operations)
(dollars in millions)
06 07 08 09* 10
$575
$700
$825
$950
Earnings Before
Interest and Taxes**
(From Continuing Operations)
(dollars in millions)
06 07 08 09* 10
$500
$550
$600
$650
*53-week fiscal year
**Information in this graph is based on a non-GAAP financial measurement. For a reconciliation of these annual amounts, please refer to our website at www.darden.com/investors/nongaap.asp.