Qantas 2010 Annual Report Download - page 41
Download and view the complete annual report
Please find page 41 of the 2010 Qantas annual report below. You can navigate through the pages in the report by either clicking on the pages listed below, or by using the keyword search tool below to find specific information within the annual report.-
 1
1 -
2
-
3
-
4
-
5
-
6
-
7
-
8
-
9
-
10
-
11
-
12
-
13
-
14
-
15
-
16
-
17
-
18
-
19
-
20
-
21
-
22
-
23
-
24
-
25
-
26
-
27
-
28
-
29
-
30
-
 31
31 -
 32
32 -
 33
33 -
 34
34 -
 35
35 -
 36
36 -
 37
37 -
 38
38 -
 39
39 -
 40
40 -
 41
41 -
 42
42 -
 43
43 -
 44
44 -
 45
45 -
 46
46 -
 47
47 -
 48
48 -
 49
49 -
 50
50 -
 51
51 -
52
-
53
-
54
-
55
-
56
-
57
-
58
-
59
-
60
-
61
-
62
-
63
-
64
-
65
-
66
-
67
-
68
-
69
-
70
-
71
-
72
-
73
-
74
-
75
-
76
-
77
-
78
-
79
-
80
-
81
-
82
-
83
-
84
-
85
-
86
-
87
-
88
-
89
-
90
-
91
-
92
-
93
-
94
-
95
-
96
-
97
-
98
-
99
-
100
-
101
-
102
-
103
-
104
-
105
-
106
-
107
-
108
-
109
-
110
-
111
-
112
-
113
-
114
-
115
-
116
-
117
-
118
-
119
-
120
 |
 |
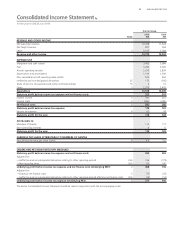
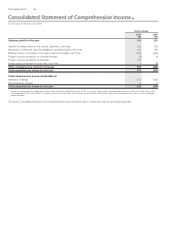
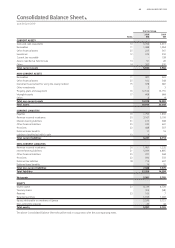
39 ANNUAL REPORT 2010
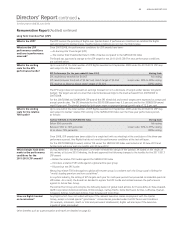
for the year ended 30 June 2010
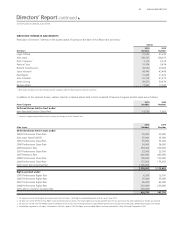
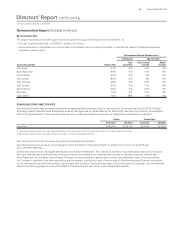
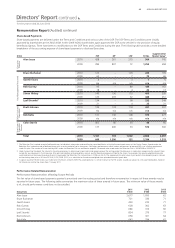
Remuneration Mix
The target remuneration mix (refer page 36) will not match the actual remuneration mix for 2009/2010, as:
—No cash incentives were paid in 2009/2010, except to Mr Storrie
—Actual reward mix is calculated on an accrual basis in accordance with Accounting Standards, so includes the value of share-based payments
awarded in previous years
Performance Related Remuneration
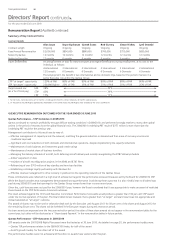
Cash-based Equity-based
Actual Reward Mix FAR & other
Cash
Incentives
Share-based
Awards
Rights
Awards
Alan Joyce 67% 0% 24% 9%
Bruce Buchanan 80% 0% 11% 9%
Gareth Evans 94% 0% 4% 2%
Rob Gurney 82% 0% 9% 9%
Simon Hickey 68% 0% 23% 9%
Lyell Strambi 81% 0% 11% 8%
Brett Johnson 66% 0% 25% 9%
Rob Kella 70% 0% 21% 9%
Colin Storrie 70% 28% (2%) 4%
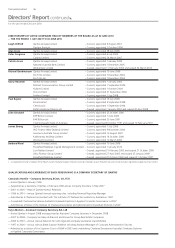
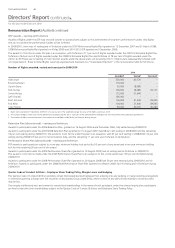
5) NON-EXECUTIVE DIRECTOR FEES
Non-Executive Director fees are determined within an aggregate Non-Executive Directors’ fee pool limit. An annual total fee pool of $2.5 million
(excluding industry standard travel entitlements received) was approved by shareholders at the 2004 AGM. Non-Executive Directors’ remuneration
re ects the responsibilities of Non-Executive Directors and is determined based on the advice of independent remuneration consultants.
Board Committees1
Chairman2Member Chairman Member
Board fees $544,000 $136,000 $54,400 $27,200
1. Committees include the Audit Committee, Remuneration Committee, Nominations Committee, and Safety, Health, Environment & Security Committee.
2. The Chairman does not receive any additional fees for serving on, or chairing, any Board Committee.
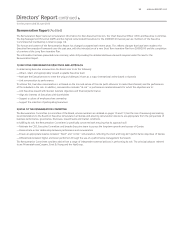
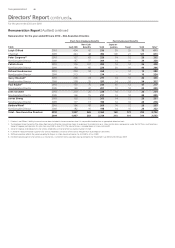
Non-Executive Directors do not receive any performance related remuneration.
Non-Executive Directors are paid a travel allowance when travelling on international ights of greater than six hours to attend Board
and Committee Meetings.
All Non-Executive Directors and eligible bene ciaries receive travel entitlements. The Chairman is entitled to four international trips and 12 domestic
trips each calendar year and all other Non-Executive Directors are entitled to two international trips and six domestic trips each calendar year.
These ights are not cumulative and will lapse if they are not used during the calendar year in which the entitlement relates. Post employment,
the Chairman is entitled to two international trips and six domestic trips for each year of service and all other Non-Executive Directors are entitled
to one international trip and three domestic trips for each year of service. The accounting value of the travel bene t is captured in the remuneration
table on the following page (as a non-cash bene t for travel during the year and as a post-employment bene t).
Remuneration Report (Audited) continued
Directors’ Report continued