Qantas 2010 Annual Report Download - page 21
Download and view the complete annual report
Please find page 21 of the 2010 Qantas annual report below. You can navigate through the pages in the report by either clicking on the pages listed below, or by using the keyword search tool below to find specific information within the annual report.-
 1
1 -
2
-
3
-
4
-
5
-
6
-
7
-
8
-
9
-
10
-
 11
11 -
 12
12 -
 13
13 -
 14
14 -
 15
15 -
 16
16 -
 17
17 -
 18
18 -
 19
19 -
 20
20 -
 21
21 -
 22
22 -
 23
23 -
 24
24 -
 25
25 -
 26
26 -
 27
27 -
 28
28 -
 29
29 -
 30
30 -
 31
31 -
32
-
33
-
34
-
35
-
36
-
37
-
38
-
39
-
40
-
41
-
42
-
43
-
44
-
45
-
46
-
47
-
48
-
49
-
50
-
51
-
52
-
53
-
54
-
55
-
56
-
57
-
58
-
59
-
60
-
61
-
62
-
63
-
64
-
65
-
66
-
67
-
68
-
69
-
70
-
71
-
72
-
73
-
74
-
75
-
76
-
77
-
78
-
79
-
80
-
81
-
82
-
83
-
84
-
85
-
86
-
87
-
88
-
89
-
90
-
91
-
92
-
93
-
94
-
95
-
96
-
97
-
98
-
99
-
100
-
101
-
102
-
103
-
104
-
105
-
106
-
107
-
108
-
109
-
110
-
111
-
112
-
113
-
114
-
115
-
116
-
117
-
118
-
119
-
120
 |
 |

19 ANNUAL REPORT 2010
for the year ended 30 June 2010
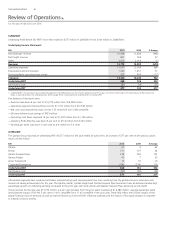
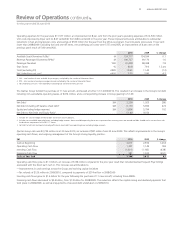
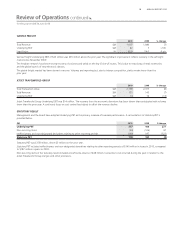
QANTAS FREIGHT
2010 2009 % change
Total Revenue $M 1,007 1,080 (7)
Underlying EBIT $M 42 7 >100
Load Factor % 60.0 54.0 6 pts
Qantas Freight’s Underlying EBIT of $42 million was $35 million above the prior year. The signi cant improvement re ects recovery in the airfreight
market since November 2009.
The freighter network has shown strong recovery of volumes and yields on the key China-US routes. This is due to restocking of retail inventories
and the global launch of new electronic devices.
The global freight market has been slower to recover. Volumes are improving but, due to intense competition, yields remain lower than the
prior year.
JETSET TRAVELWORLD GROUP
2010 2009 % change
Total Transaction Value $M 2,198 2,377 (8)
Total Revenue $M 135 145 (7)
Underlying EBIT $M 14 16 (13)
Jetset Travelworld Group Underlying EBIT was $14 million. The recovery from the economic downturn has been slower than anticipated with volumes
lower than the prior year. A continued focus on cost control has helped to offset the revenue decline.
STATUTORY RESULT
Management and the Board have adopted Underlying PBT as the primary measure of business performance. A reconciliation to Statutory PBT is
provided below.
$M 2010 2009 $ change
Underlying PBT 377 100 277
Non-recurring items (59) (106) 47
Ineffectiveness and non-designated derivatives relating to other reporting periods (140) 187 (327)
Statutory PBT 178 181 (3)
Statutory PBT was $178 million, down $3 million on the prior year.
Statutory PBT includes ineffectiveness and non-designated derivatives relating to other reporting periods of $140 million in losses in 2010, compared
to $187 million in gains in 2009.
Non-recurring items in the statutory result included aircraft write-downs of $48 million, transaction costs incurred during the year in relation to the
Jetset Travelworld Group merger, and other provisions.
Review of Operations continued