Qantas 2010 Annual Report Download - page 112
Download and view the complete annual report
Please find page 112 of the 2010 Qantas annual report below. You can navigate through the pages in the report by either clicking on the pages listed below, or by using the keyword search tool below to find specific information within the annual report.-
 1
1 -
2
-
3
-
4
-
5
-
6
-
7
-
8
-
9
-
10
-
11
-
12
-
13
-
14
-
15
-
16
-
17
-
18
-
19
-
20
-
21
-
22
-
23
-
24
-
25
-
26
-
27
-
28
-
29
-
30
-
31
-
32
-
33
-
34
-
35
-
36
-
37
-
38
-
39
-
40
-
41
-
42
-
43
-
44
-
45
-
46
-
47
-
48
-
49
-
50
-
51
-
52
-
53
-
54
-
55
-
56
-
57
-
58
-
59
-
60
-
61
-
62
-
63
-
64
-
65
-
66
-
67
-
68
-
69
-
70
-
71
-
72
-
73
-
74
-
75
-
76
-
77
-
78
-
79
-
80
-
81
-
82
-
83
-
84
-
85
-
86
-
87
-
88
-
89
-
90
-
91
-
92
-
93
-
94
-
95
-
96
-
97
-
98
-
99
-
100
-
101
-
 102
102 -
 103
103 -
 104
104 -
 105
105 -
 106
106 -
 107
107 -
 108
108 -
 109
109 -
 110
110 -
 111
111 -
 112
112 -
 113
113 -
 114
114 -
 115
115 -
 116
116 -
 117
117 -
 118
118 -
 119
119 -
 120
120
 |
 |
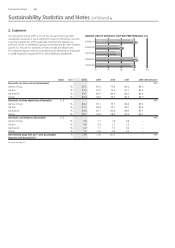
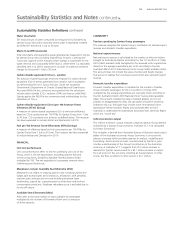
THE QANTAS GROUP 110
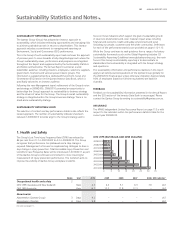
Fuel conservation is the most important element of the Group’s
environmental strategy. Improving fuel ef ciency is one of the Group’s
greatest opportunities to minimise cost and manage its environmental
impact. It also enables the Group to better absorb uctuations in oil
prices. In early 2010, the Group reached a key milestone of avoiding
one million tonnes of CO2-e through fuel conservation activities since
the program’s launch in 2004/2005.
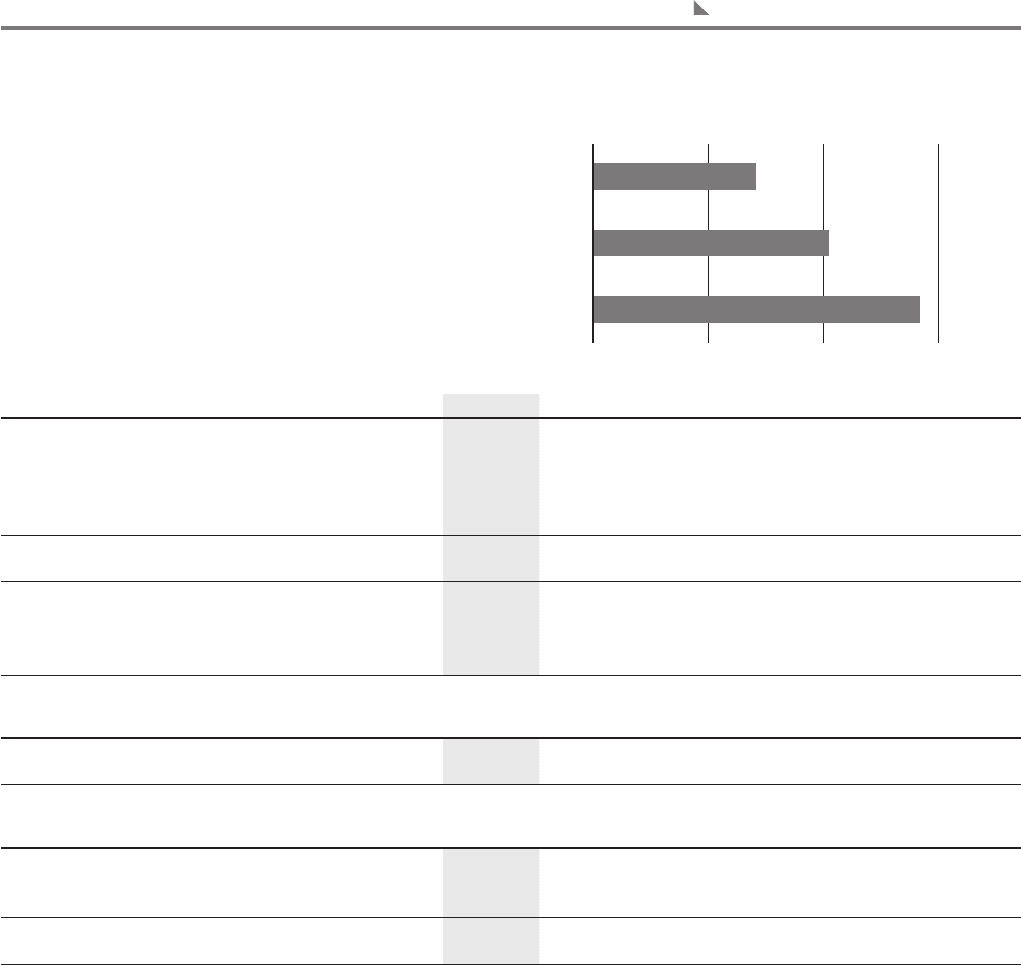
AVIATION CO2-e EMISSIONS (TONNES)
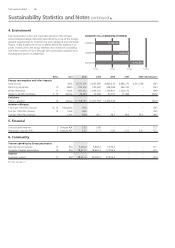
Sustainability Statistics and Notes continued
4. Environment
Notes Unit 2010 2009 2008 2007 2006 GRI indicator1
Energy consumption and other impacts
Aviation fuel 000L 4,570,556 4,695,383 4,849,430 4,680,270 4,561,238 EN3
Electricity (Australia) 10 MWh 235,303 239,987 248,386 246,730 – EN3
Water (Australia) 11 000L 991,022 1,046,241 1,143,801 1,204,132 – EN8
Waste to land ll (Australia) 5, 12 Tonnes 28,243 29,928 30,767 31,686 – EN22
Emissions
CO2-e – aviation 13 Tonnes 11,708,155 12,027,918 12,422,533 – – EN16
Aviation ef ciency
CO2-e per 100 RTKs (Group) 13, 14 Kilograms 98.8 ––––EN5
Fuel per 100 RTKs (Group) 14 Litres 38.6 ––––EN5
Fuel per 100 RTKs (Qantas) Litres 38.8 40.1 38.7 38.4 39.5 EN5
5. Financial
Unit cost performance 5 Cents per ASK 5.55 5.80 – – – EC1
Manpower cost per ASK 5 Cents per ASK 2.62 2.77 2.63 2.52 2.61 EC1
6. Community
Tourism spending by Group passengers
National export revenue 15 $M 5,406.2 5,828.2 5,976.2 – – EC1
Domestic traveller expenditure 16 $M 18,917.1 18,622.3 17,256.2 – – EC1
Indirect ––
Economic output 17 $M 28,921.2 30,559.2 32,816.7 – – EC9
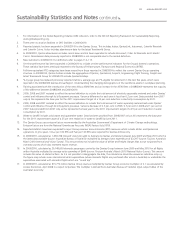
For notes see page 111.
11.0m 11.5m 12.0m 12.5m
2009/2010
2008/2009
2007/2008
11,708,155
12,027,918
12,422,533