Qantas 2010 Annual Report Download - page 20
Download and view the complete annual report
Please find page 20 of the 2010 Qantas annual report below. You can navigate through the pages in the report by either clicking on the pages listed below, or by using the keyword search tool below to find specific information within the annual report.-
 1
1 -
2
-
3
-
4
-
5
-
6
-
7
-
8
-
9
-
 10
10 -
 11
11 -
 12
12 -
 13
13 -
 14
14 -
 15
15 -
 16
16 -
 17
17 -
 18
18 -
 19
19 -
 20
20 -
 21
21 -
 22
22 -
 23
23 -
 24
24 -
 25
25 -
 26
26 -
 27
27 -
 28
28 -
 29
29 -
 30
30 -
31
-
32
-
33
-
34
-
35
-
36
-
37
-
38
-
39
-
40
-
41
-
42
-
43
-
44
-
45
-
46
-
47
-
48
-
49
-
50
-
51
-
52
-
53
-
54
-
55
-
56
-
57
-
58
-
59
-
60
-
61
-
62
-
63
-
64
-
65
-
66
-
67
-
68
-
69
-
70
-
71
-
72
-
73
-
74
-
75
-
76
-
77
-
78
-
79
-
80
-
81
-
82
-
83
-
84
-
85
-
86
-
87
-
88
-
89
-
90
-
91
-
92
-
93
-
94
-
95
-
96
-
97
-
98
-
99
-
100
-
101
-
102
-
103
-
104
-
105
-
106
-
107
-
108
-
109
-
110
-
111
-
112
-
113
-
114
-
115
-
116
-
117
-
118
-
119
-
120
 |
 |

THE QANTAS GROUP 18
for the year ended 30 June 2010
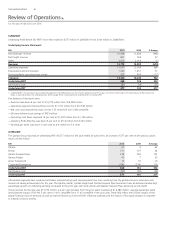
QANTAS
2010 2009 % change
Total Revenue $M 10,609 11,624 (9)
Underlying EBIT $M 67 4 >100
Seat Factor % 81.3 80.1 1.2 pts
Qantas achieved an Underlying EBIT of $67 million for the full year, $63 million above the prior year. This result re ects effective capacity and yield
management during tough economic conditions. Fuel savings resulting from lower average fuel into-plane prices, operational savings from capacity
reductions and $533 million in QFuture bene ts have contributed to the pro table result for the year.
Passenger revenue declined 10 per cent compared to the prior year, primarily due to capacity reductions across the international network which was
required to mitigate the softening in demand experienced during the economic downturn.
Weak premium demand affected international yields particularly in the rst half of the year. Yields began to recover in the second half, however
recovery was impacted by international events including Icelandic volcano disruptions and political unrest in Bangkok. The effects of the Icelandic
volcano on Qantas’ earnings totalled $46 million.
Whilst international capacity decreased 9.4 per cent compared to the prior year, seat factor remained strong at 82.5 per cent.
Qantas domestic yields, while lower than the prior year, are improving from the lowest point reached in the second half of 2009 and the beginning
of 2010. Business demand continues to recover.
QFuture
The QFuture business transformation program aims to equip Qantas for sustainable and pro table growth in an increasingly competitive operating
environment.
QFuture initiatives achieved a $533 million bene t in terms of cost savings and new revenue in the program’s rst full year, with signi cant savings
in manpower, fuel conservation, IT and other direct costs.
The program continues to target a total $1.5 billion bene ts by the end of 2011/2012.
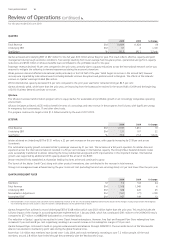
JETSTAR
2010 2009 % change
Total Revenue $M 2,197 1,851 19
Underlying EBIT $M 131 107 22
Seat Factor % 79.2 77.4 1.8 pts
Jetstar achieved an Underlying EBIT of $131 million, a 22 per cent increase on the prior year, with capacity increasing by 27.8 per cent across
its network.
This substantial capacity growth increased Jetstar’s passenger revenue by 21 per cent. The inclusion of a full year’s operation for Jetstar Asia and
expansion across the international network resulted in a 50 per cent increase in international capacity. The Group’s New Zealand domestic routes
were successfully transferred to Jetstar, delivering the Group substantial savings and pro t improvements in this important market. International
growth was supported by additional A330 capacity ahead of the arrival of the B787.
Jetstar remained rmly established as Australia’s leading low fares airline and continued to grow.
The launch of the Jetstar Credit Card, along with other product innovations, also contributed to the increase in total revenue.
Strong cost management was achieved during the year. Gross unit cost (excluding fuel and non-recurring items) is 2 per cent lower than the prior year.
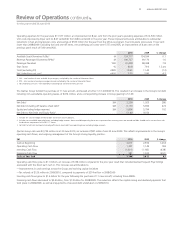
QANTAS FREQUENT FLYER
2010 2009 % change
Members M 7.2 5.8 24
Total Revenue $M 1,108 1,049 6
Underlying EBIT $M 328 226 45
Normalisation Adjustment $M (161) (77) >100
Normalised EBIT1$M 167 149 12
1. Normalised EBIT is a non-statutory measure which restates redemption revenue to the fair value of awards redeemed (removing the impact of the change in accounting estimate) and recognises
the ‘marketing revenue’ when a point is sold. This creates a comparable basis for the presentation of results.
Qantas Frequent Flyer achieved a record Underlying EBIT of $328 million which was $102 million higher than the prior year. This result includes the
full-year impact of the change in accounting estimate implemented on 1 January 2009, which has contributed $161 million to the 2009/2010 result,
compared to $77 million in 2008/2009 (calculated on a normalised basis).
The reduction in Qantas’ capacity has resulted in lower Classic Award redemptions. However, Any Seat and Frequent Flyer Store redemptions have
increased 21 per cent and 8 per cent respectively, resulting in an overall increase in the redemption margin of 10 per cent.
Qantas Frequent Flyer continued to build on program enhancements and alliances through 2009/2010. The successful launch of the Woolworths
alliance has assisted in maintaining point sales during the global nancial crisis.
More than 1.4 million new members have joined since 1 July 2009, with total membership increasing to over 7.2 million people. Of the total
members, around 2.8 million have linked through the partnership with the Woolworths Group.
Review of Operations continued