Qantas 2010 Annual Report Download - page 110
Download and view the complete annual report
Please find page 110 of the 2010 Qantas annual report below. You can navigate through the pages in the report by either clicking on the pages listed below, or by using the keyword search tool below to find specific information within the annual report.-
 1
1 -
2
-
3
-
4
-
5
-
6
-
7
-
8
-
9
-
10
-
11
-
12
-
13
-
14
-
15
-
16
-
17
-
18
-
19
-
20
-
21
-
22
-
23
-
24
-
25
-
26
-
27
-
28
-
29
-
30
-
31
-
32
-
33
-
34
-
35
-
36
-
37
-
38
-
39
-
40
-
41
-
42
-
43
-
44
-
45
-
46
-
47
-
48
-
49
-
50
-
51
-
52
-
53
-
54
-
55
-
56
-
57
-
58
-
59
-
60
-
61
-
62
-
63
-
64
-
65
-
66
-
67
-
68
-
69
-
70
-
71
-
72
-
73
-
74
-
75
-
76
-
77
-
78
-
79
-
80
-
81
-
82
-
83
-
84
-
85
-
86
-
87
-
88
-
89
-
90
-
91
-
92
-
93
-
94
-
95
-
96
-
97
-
98
-
99
-
 100
100 -
 101
101 -
 102
102 -
 103
103 -
 104
104 -
 105
105 -
 106
106 -
 107
107 -
 108
108 -
 109
109 -
 110
110 -
 111
111 -
 112
112 -
 113
113 -
 114
114 -
 115
115 -
 116
116 -
 117
117 -
 118
118 -
 119
119 -
 120
120
 |
 |

THE QANTAS GROUP 108
Sustainability Statistics and Notes continued
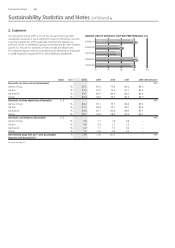
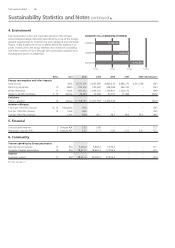
On-time performance (OTP) is one of the Group’s most important
operational measures. It has a signi cant impact on ef ciency, cost and
customer satisfaction. OTP is especially important for Qantas as a
premium carrier. In 2009/2010 Qantas out-performed all other domestic
carriers for the year for domestic on-time arrivals and departures.
The industrial dispute with the Licensed Aircraft Maintenance Engineers
in 2008 negatively impacted OTP in 2007/2008 and 2008/2009.
QANTAS GROUP DOMESTIC ON-TIME PERFORMANCE (%)
2. Customer
Notes Unit 2010 2009 2008 2007 2006 GRI indicator1
Domestic on-time arrivals (Australia) PR5
Qantas Group % 85.2 80.4 79.4 86.2 84.9
Qantas % 87.4 81.0 79.6 87.1 85.9
QantasLink % 83.7 80.9 80.6 86.0 83.6
Jetstar % 82.9 78.2 76.5 84.5 84.9
Domestic on-time departures (Australia) 5, 6 PR5
Qantas Group % 86.2 81.1 79.7 86.4 85.6
Qantas % 87.7 80.8 79.1 86.7 85.6
QantasLink % 86.8 83.7 82.8 88.0 85.7
Jetstar % 82.1 76.8 78.4 85.9 85.7
Domestic cancellations (Australia) 5, 6 PR5
Qantas Group % 0.8 1.7 1.8 0.8 –
Qantas % 0.8 2.6 2.3 1.0 –
QantasLink % 0.7 1.1 1.2 0.6 –
Jetstar % 1.1 0.9 0.9 0.5 –
Mishandled bags les per 1,000 passengers
(Qantas and QantasLink)
# 7.39 7.50 8.31 – – PR5
For notes see page 111.
70 75 80 85 90
2009/2010
2008/2009
2007/2008
2006/2007
2005/2006
85.2
86.2
80.4
81.1
79.4
79.7
86.2
86.4
84.9
85.6
ARRIVALS
DEPARTURES