Qantas 2003 Annual Report Download - page 44
Download and view the complete annual report
Please find page 44 of the 2003 Qantas annual report below. You can navigate through the pages in the report by either clicking on the pages listed below, or by using the keyword search tool below to find specific information within the annual report.-
 1
1 -
2
-
3
-
4
-
5
-
6
-
7
-
8
-
9
-
10
-
11
-
12
-
13
-
14
-
15
-
16
-
17
-
18
-
19
-
20
-
21
-
22
-
23
-
24
-
25
-
26
-
27
-
28
-
29
-
30
-
31
-
32
-
33
-
 34
34 -
 35
35 -
 36
36 -
 37
37 -
 38
38 -
 39
39 -
 40
40 -
 41
41 -
 42
42 -
 43
43 -
 44
44 -
 45
45 -
 46
46 -
 47
47 -
 48
48 -
 49
49 -
 50
50 -
 51
51 -
 52
52 -
 53
53 -
 54
54 -
55
-
56
-
57
-
58
-
59
-
60
 |
 |

2003 Qantas Annual Report
DISCUSSION AND ANALYSIS OF THE STATEMENT OF FINANCIAL PERFORMANCE continued
for the year ended 30 June 2003
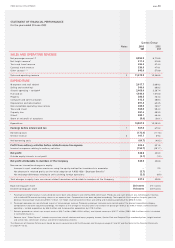
REVIEW OF EXPENDITURE
To tal expenditure, excluding net borrowing costs, increased by $518.4 million or 5.0 per cent to $10.8 billion. Excluding the favourable impact
of movements in foreign exchange rates, this increase amounted to $771.6 million or 7.5 per cent. Increased expenditure was mainly due to
costs associated with the 3.7 per cent increase in capacity, higher depreciation due to new aircraft deliveries and the write down of the 767-200
fleet, higher manpower costs following the settlement of Enterprise Bargaining Agreements (EBAs), higher superannuation contributions, and
redundancy costs arising from the reorganisation program announced in April 2003.
Cost per ASK decreased by 1.3 per cent. Excluding foreign exchange impacts, the cost per ASK increased by 1.2 per cent.
Manpower and staff related expenditure increased by $328.5 million or 12.2 per cent due to an increase in full-time employees as a result of
continued network shift towards the domestic market and greater activity, higher wages due to EBA settlements, additional superannuation
contributions and increased redundancy costs, offset by the reduction in employee and executive bonus payments.
Selling and marketing expenditure decreased by $61.6 million or 10.1 per cent as a result of reduced sales commissions due to reduced rates,
network shift to the domestic network, reduced incentive payments due to lower international revenue, and increased internet bookings.
Aircraft operating variable costs increased by $117.6 million mainly due to increased landing fees caused by increased activity and the full year
impact of price increases at Australian airports, and increased passenger related expenses predominantly as a result of higher security costs.
Fuel costs decreased by 1.9 per cent or $29.6 million. The underlying fuel price was 15.8 per cent higher than last year, increasing costs
by $209.2 million. However, hedging benefits were $107.6 million better than the previous year. While flying hours increased, fuel efficiency
gains from new fleet acquisitions reduced the number of litres consumed per hour, resulting in an overall activity saving of $5.3 million versus
the prior year. Favourable foreign exchange rate movements also reduced fuel costs by $125.9 million.
Property costs increased by $22.2 million or 8.4 per cent due to higher activity, rental increases, the extension of airport lounges, the lease of
Terminal 2 at Sydney Airport, and the lease of former Ansett hangars. This was partly offset by the reduction in some international terminal
charges.
Depreciation and amortisation increased by $197.9 million or 28.5 per cent due to depreciation on aircraft acquisitions and accelerated
depreciation of 767-200 aircraft.
Non-cancellable lease rentals increased by 11.0 per cent or $28.2 million due to the full year impact of the 717-200 leases which were
acquired as part of the Impulse Airlines Group purchase in November 2001.
Tours and travel cost of sales decreased $20.4 million or 3.5 per cent due to a reduction in overseas sales and a switch towards cheaper
domestic packages.
Capacity hire reduced by $118.3 million or 23.7 per cent reflecting the termination of some wet-lease capacity entered into after the collapse
of Ansett and the transfer of Impulse 717-200 costs to non-cancellable lease rentals following the acquisition of the Impulse Airlines Group.
These were partly offset by increased codeshare costs.
Other expenditure increased by $23.5 million or 5.1 per cent primarily as a result of increased insurance costs due to the full year impact
of post September 11 insurance premiums.
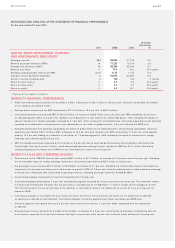
REVIEW OF OTHER STATEMENT OF FINANCIAL PERFORMANCE ITEMS
Net borrowing costs increased by 34.0 per cent or $16.4 million. Average net debt was $2.5 billion, $0.7 billion higher than the prior year.
Interest rates were lower and $82.7 million of interest was capitalised into aircraft progress payments (compared with $77.0 million in the
previous year).
The favourable net impact of foreign exchange rate movements on the overall profit before tax was $106.8 million.
The effective tax rate decreased by 1.0 percentage point to 31.0 per cent.
Earnings per share decreased by 31.3 per cent to 20.0 cents. Diluted earnings per share reduced by 31.5 per cent to 19.8 cents.
page 42